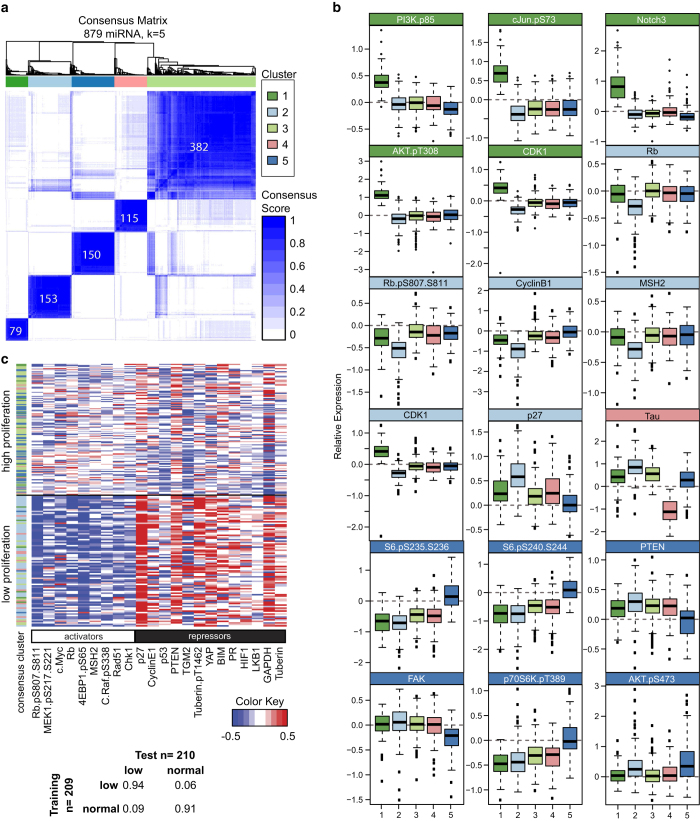
Figure 1.
Consensus clustering of miRNAs according to their functional roles in regulating cancer pathways. (a) Heatmap of miRNA consensus clusters and the number of miRNAs in each cluster. (b) Box-whisker plots of discriminatory proteins in the first screen regulated by miRNA clusters. Cluster 1 miRNAs (dark green) upregulated PI3K/AKT, Notch and c-Jun signals. Cluster 2 miRNAs (light blue) regulated the levels cell cycle proteins. Cluster 4 miRNAs (pink) downregulated Tau levels. Cluster 5 miRNAs (dark blue) upregulated the mTOR pathway. (c) Heatmap of the fold change in levels of protein activators and repressors. Each row represents a miRNA-transfected observation, and each column represents a protein. The miRNAs are grouped according to their effect on cell proliferation. Table inset, confusion matrix of a SVM model predictors of cell number changes.

