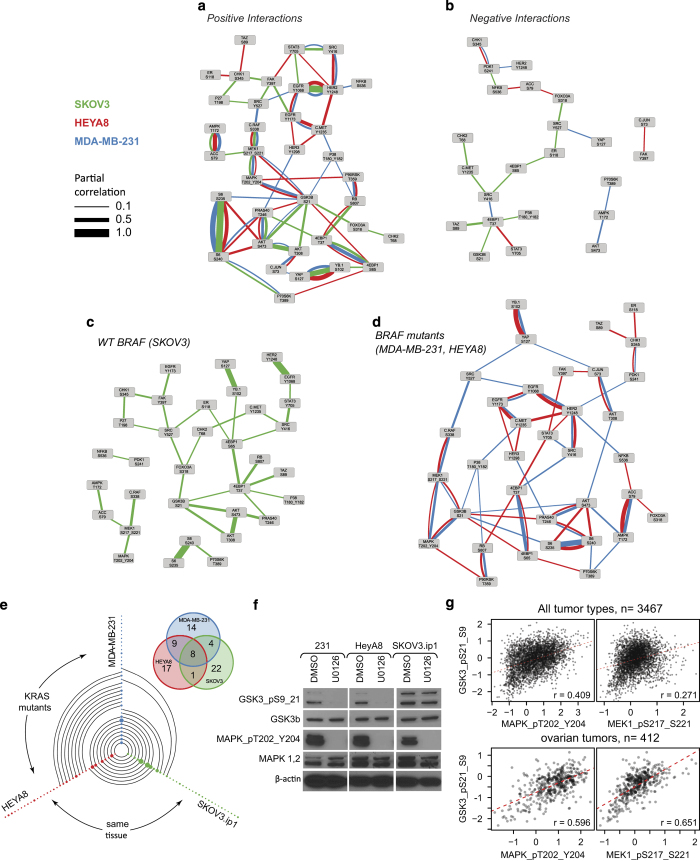
Figure 3.
De novo phosphoprotein networks. (a,b) Positive and negative interplay between phosphoprotein components of signaling networks as estimated by graphical network modeling of miRNA perturbation data specific to the cell lines shown. (c,d) Differences in signaling networks between cell lines with differing KRAS and BRAF mutational statuses. (e) Hive plot of the phosphoprotein links in each cell line (node) and the common links among the cell lines (edges). Inset, Venn diagram of the common links across all three cell lines. (f) Western blot analysis of the effect of the MEK inhibitor U0126 on ERK and GSK3β phosphorylation in the three cell lines. (g) Scatter plots demonstrating correlation between MEK, ERK, and GSK3β phosphorylation in The Cancer Genome Atlas (TCGA) pancancer and ovarian tumor samples.

