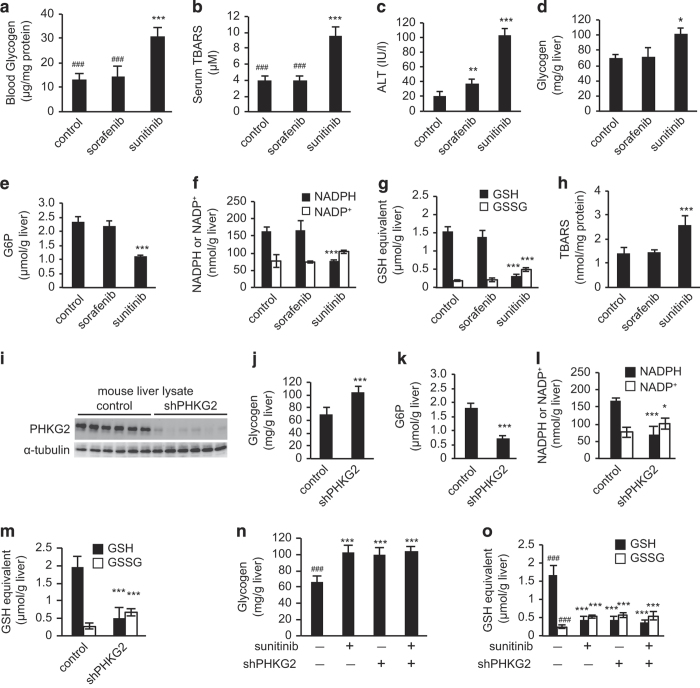
Figure 3.
In vivo experiments confirm in silico simulation predictions that oxidative stress is induced in the liver by inhibiting phosphorylase kinase gamma 2 (PHKG2). (a–h) Mice were fed a diet containing sunitinib or sorafenib for 14 days, after which serum and blood biomarkers and hepatic metabolite levels were analyzed. Blood glycogen content (a) and serum thiobarbituric acid reactive substance (TBARS) levels (b) are higher in the sunitinib-treated group than those in the untreated control and sorafenib-treated groups, consistent with the clinical observations shown in Figure 2. Serum alanine aminotransferase (ALT) (c) is also elevated in the sunitinib-treated group, indicating the development of liver damage. Sunitinib administration increases hepatic glycogen content (d), decreases hepatic glucose-6-phosphate (G6P) content (e), decreases the ratio of nicotinamide adenine dinucleotide phosphate (NADPH) to NADP+ in the liver (f) and decreases the ratio of glutathione (GSH) to the oxidized form, GSSG, in the liver (g). In addition, the hepatic TBARS level (h), a measure of oxidative stress, is higher in the sunitinib-treated group than that in control animals or in the sorafenib-treated group. All animal data are expressed as the mean±s.d. (n=6). *P<0.05, **P<0.01, ***P<0.001 versus control. #P<0.05, ##P<0.01, ###P<0.001 versus the sunitinib-treated group. (i–m) Mice were treated with a small hairpin RNA (shRNA) targeting PHKG2 (shPHKG2) or control adenovirus, and the effects were determined 3 days later. Knockdown of hepatic PHKG2 expression (i) is confirmed with immunoblot analysis. The livers of mice treated with the shPHKG2 adenovirus show increased glycogen content (j) and decreased G6P content (k), together with a reduction in the NADPH/NADP+ ratio (l) and GSH/GSSG ratio (m). In addition, sunitinib administration does not show additive effects with respect to hepatic glycogen content (n) and the GSH/GSSG ratio (o). Data are expressed as the mean±s.d. (n=6). *P<0.05, **P<0.01, ***P<0.001 versus control. #P<0.05, ##P<0.01, ###P<0.001 versus the sunitinib-treated group.

