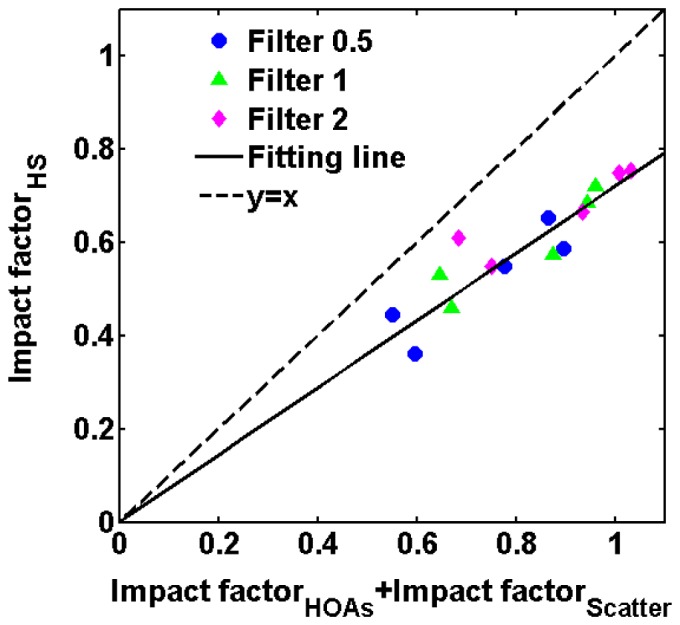
Fig. 10.

Linear fit of versus the sum of and . Each point represent an average value across subjects for a spatial frequency. Blue circles stand for results obtained with Filter S0.5; green triangles stand for results obtained with Filter S1; magenta diamonds stand for results obtained with Filter S2. The solid line represent the fitting line; the dotted line stand for the line y = x.
