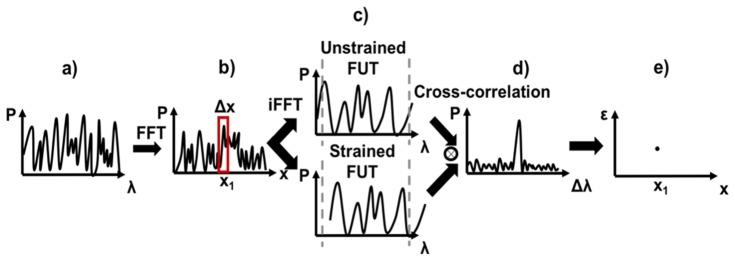
Fig. 1.
Qualitative illustration of the data process to use OFDR as a distributed strain sensor. a) represents de spectrum of the backscattering signal. b) is the intensity backscattered along the fiber, resulting from a FFT of a). c) is the spectrum of the selected region of interest define by the spatial resolution (Δx), resulting from an inverse FFT. d) is the crosscorrelation (applied in the time domain) obtain by comparing the spectra of the unstrained and strained FUT. e) represents the strain values at the determined (graph b) region of interest on the fiber.

