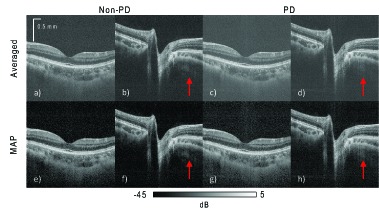
Fig. 1.

Intensity images of the macula and ONH. The four images on the left-hand side, (a), (b), (e), and (f), use non-PD OCT. The four on the right (c), (d), (g), and (h), are PD-OCT images. The images in the first row are composed by intensity averaging four repeated B-scans. Images in the second row are composed by MAP estimation from the same four repeated B-scans. Zero dB corresponds to the 99.9th percentile intensity in each image. The SIRs between the retinal pigment epithelium and vitreous, calculated from the macula images, are 31.1 dB for the MAP non-PD-OCT (e), 24.5 dB for averaging non-PD-OCT (a), 28.4 dB for MAP PD-OCT (g), and 21.7 dB for averaged PD-OCT (c).
