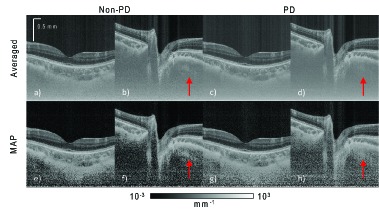
Fig. 7.

Attenuation images of the macula and ONH. The four images on the left-hand side, (a), (b), (e), and (f), are for non-PD OCT. The four images on the right-hand side, (c), (d), (g), and (h), are for PD-OCT. The images in the first row are composed using the intensity averaging of four repeated B-scans. Images in the second row are composed by MAP estimation from the same B-scans.
