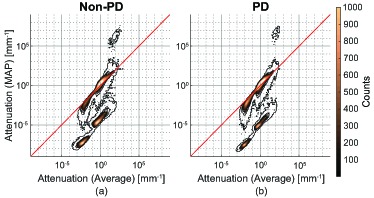
Fig. 8.

Contour plots of 2D histgrams of attenuations of corresponding pixels in MAP and averaged images of the ONH. Sub-figure (a) is from comparing attenuations of corresponding pixels in Fig. 7(f) and Fig. 7(b). Sub-figure (b) is from comparing attenuations of corresponding pixels in Fig. 7(h) and Fig. 7(d). The red line represents the location of equal attenuation.
