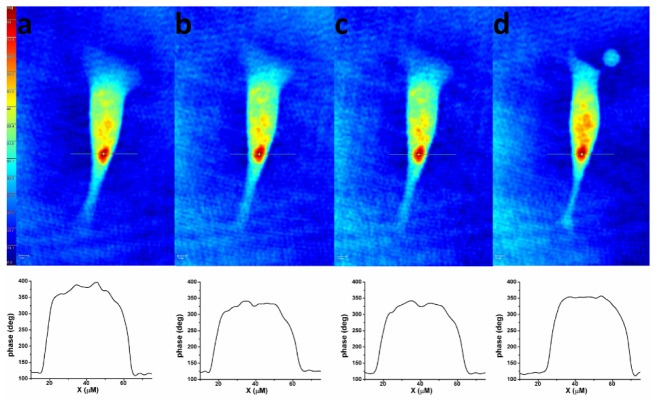
Fig. 3.
Consecutive holographic phase images of an attached B16F10 cell in two different solutions (D and M) at different time moments. Top: (a) hologram acquired in solution D before the electric pulse delivery, (b) hologram acquired in solution M before the electric pulse delivery, (c) hologram acquired in solution M at 2 seconds after pulse delivery, (d) hologram acquired in solution M at 10 minutes after pulse delivery. Bottom: phase shift profiles along cross sections through the point of maximum phase shift corresponding to each hologram.

