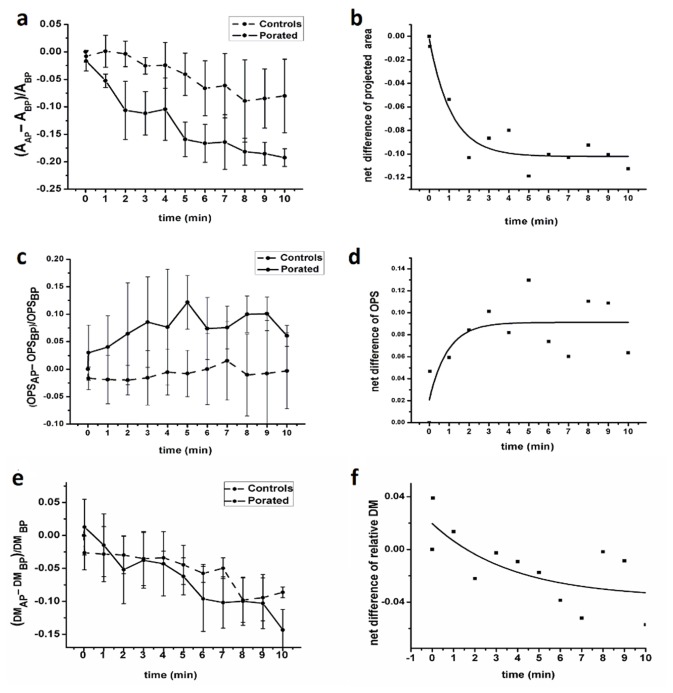
Fig. 7.
Relative variation of cellular projected area (a), averaged optical phase shift (c) and dry mass (e) after pulse delivery. Panels (b), (d) and (f) present these parameters after subtracting the controls (dots) and the exponential fit (line) of their time behavior (ABP - projected area of the cell before electroporation, AAP - projected area of the cell after electroporation, OPSBP - averaged optical phase shift profile of the cell before electroporation, OPSAP - averaged optical phase shift profile of the cell after electroporation, DMBP - averaged dry mass of the cell before electroporation, DMAP - averaged dry mass of the cell after electroporation).

