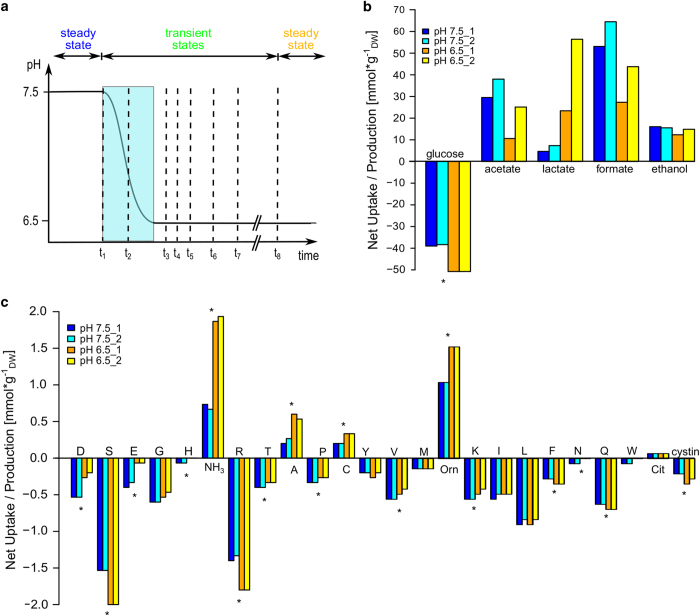
Figure 2.
Experimental setup and metabolite measurements. Uptake and production were calculated as , where C represents the metabolite concentration (mmol l−1) and X the dry weight of the cells (gDW l−1). Fluxes are calculated by multiplication with the dilution rate (d=0.15 h−1). (a) Experimental setup. The pH was shifted from 7.5 to 6.5 over the course of an hour. Samples were taken at the steady state at pH 7.5 (t1), during the pH shift (t2) at pH 7.0 after 30 min, as well as 80 min, 100 min, 120 min, 180 min, 240 min, and 21 h (t3–8) after the initializing the pH shift. (b) Carbohydrate measurements. The measured uptake and production (given in ) are determined in continuous fermentation of the chemically defined medium. (c) Amino-acid measurements. The measured uptake and production (given in ) are determined in continuous fermentation of the chemically defined medium. Cit, citruline; Orn, ornithine. Chemostat 1 and 2 represent biological replicates. Metabolites with significant changes between the steady states are indicated by *P<0.05. The flux boundaries derived from the metabolite measurements are listed in Supplementary Table S5 (pH 7.5) and Supplementary Table S6 (pH 6.5).

