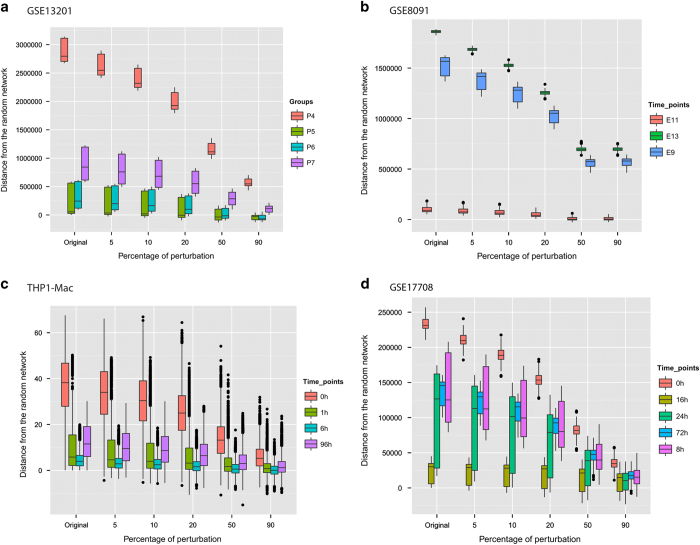
Figure 3.
Perturbation analysis of time-specific networks for each data set. a, GSE13201; b, GSE8091; c, THP1-Mac and d, GSE17708. The y axis represents the mean distance of the perturbed networks (100-fold) from the random network. We progressively randomized a subset of 5, 10, 20, 50 and 90% gene-expression values of randomly selected genes, and compared the energy values of the original networks to those obtained from randomly generated networks.

