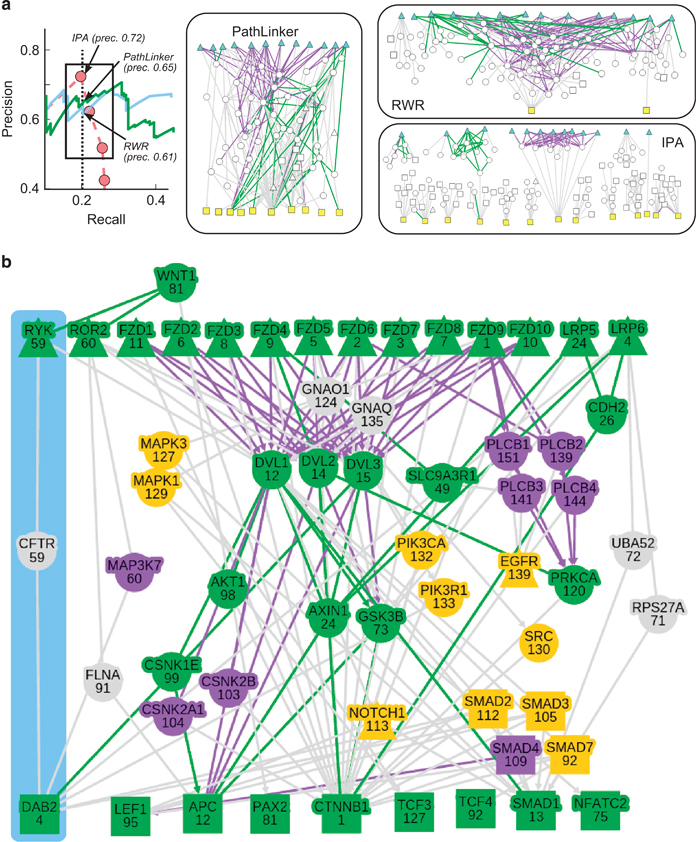
Figure 3.

Visualizations of Wnt pathway reconstructions. (a) Visualizations of PATHLINKER, RWR, and IPA pathway reconstructions at a recall of 0.2. The displayed networks correspond to this value of recall (black arrows in the precision/recall curve.) Blue triangles: Wnt receptors; yellow squares: Wnt TRs, green edges: NetPath interactions, purple edges: KEGG interactions that are not present in NetPath. (b) Network formed by the 200 highest scoring paths in PATHLINKER’s reconstruction of the Wnt pathway. The number in each node denotes the index of the first path in which that protein appears. Triangles: receptors; squares: TRs, green nodes/edges: NetPath proteins/interactions, purple nodes/edges: KEGG proteins/interactions that are not present in NetPath, orange nodes: proteins known to be involved in Wnt signaling crosstalk. The blue region highlights the novel Ryk–CFTR–Dab2 path, which we experimentally validate in this paper. IPA, Ingenuity Pathway Analyzer; RWR, random walk with restarts.
