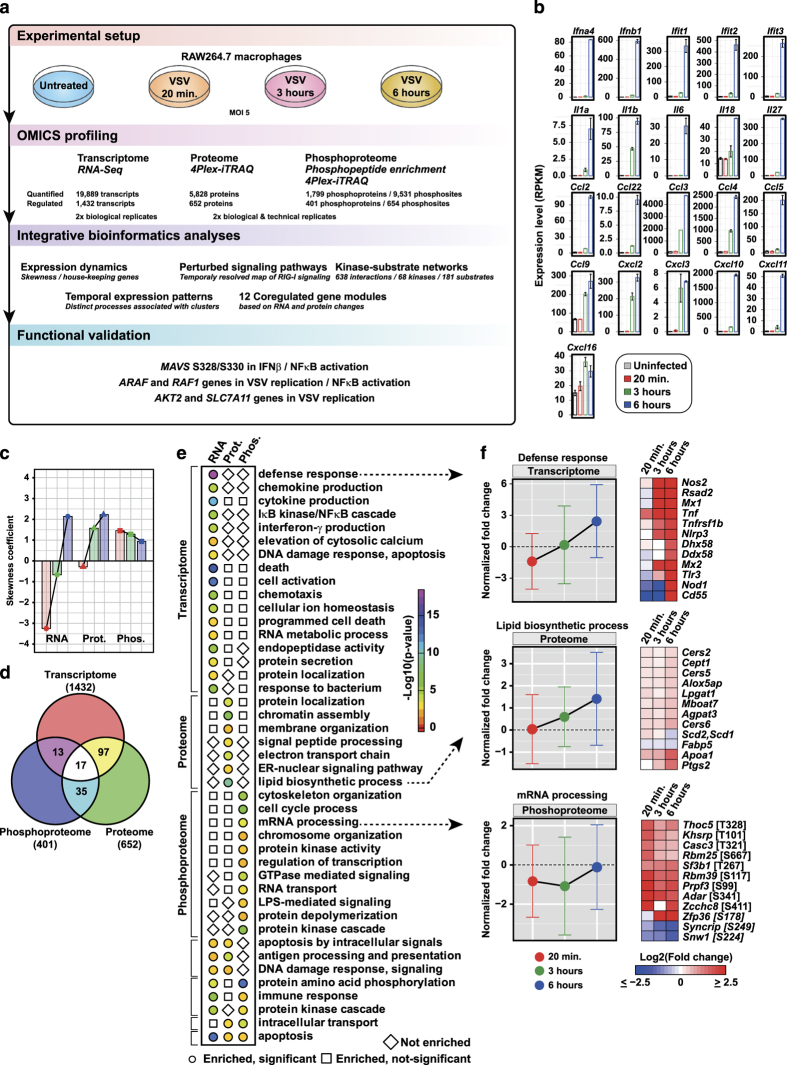
Figure 1.
Overview of the experimental outline, analyses, and clustering patterns. (a) Workflow outlining the experimental design, profiling, and bioinformatics analyses. (b) Transcriptome changes of selected genes upon vesicular stomatitis virus (VSV) infection. (c) Skewness coefficient for the distribution of fold changes based on Z score for transcriptome, proteome, and phosphoproteome for each time point after infection. (d) Venn diagram depicting the overlap of differentially expressed genes at transcriptome, proteome, and phosphoproteome levels. (e) Significantly enriched biological processes (P value⩽0.005) at transcriptome, proteome, and phosphoproteome. (f) The normalized mean expression changes for each time point after VSV infection with error bars depicting the extent of expression changes for the subset of genes associated with three representative biological processes that are significantly regulated at transcriptome/proteome/phosphoproteome. Heatmap depicts the expression changes of selected genes associated with the respective biological process.

