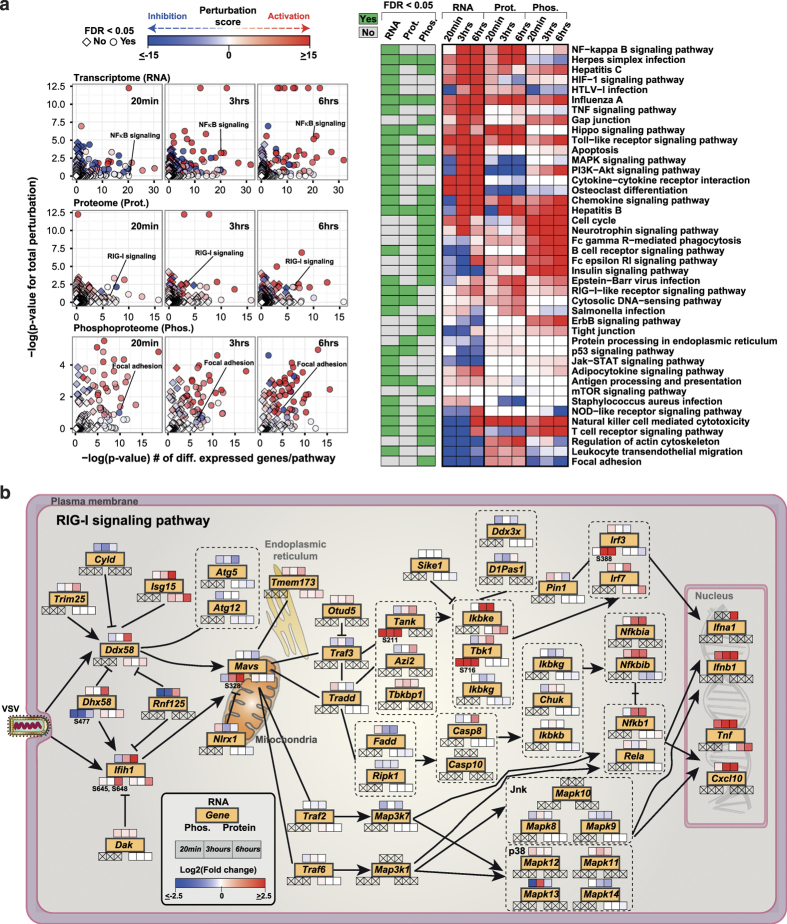
Figure 4.
Pathway perturbation analysis and dynamics of RIG-I signaling pathway. (a) Scatter plot summarizing the results of the signaling pathway impact analysis of differentially regulated transcriptome, proteome, and phosphoproteome at 20 min, 3 h, and 6 h after vesicular stomatitis virus (VSV) infection, and heatmap representing the total perturbation values for signaling pathways with false discovery rate (FDR)⩽0.05 at the transcriptome/proteome/phosphoproteome level. (b) The RIG-I signaling pathway (adapted from KEGG database) overlaid with the OMICS data. Genes are marked in yellow filled rectangles. Heatmap strip on top, bottom-right, and bottom-left represent changes at transcriptome, proteome, and phosphoproteome, respectively. Data points with no available OMICS data are marked with an X. Phosphorylation sites are also marked.

