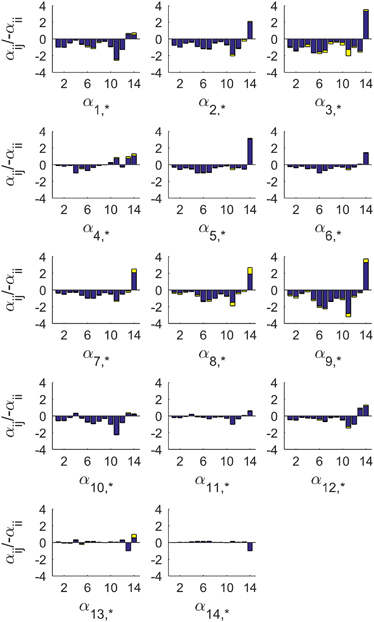
Figure 2.

Estimated interactions (αij) between pairs of the 14 subcommunities (SCs). The y axis shows αij values, scaled by −1/αii, of SC 1 to 14. Each blue bar shows the mean value and each yellow extension represents the s.d. of the top 200 parametric instantiations of the SC model. It is evident that most interaction parameters are negative, at least for SC1 to SC12. SC14, and to a lesser degree SC13, are different in their effects and in how they are affected.
