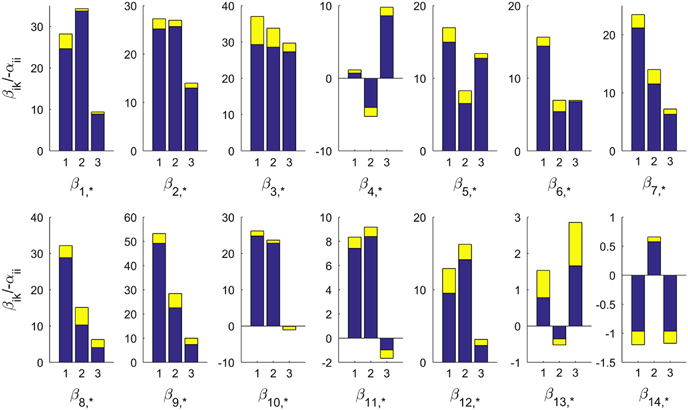
Figure 3.

Estimated environmental effects (βik) on the 14 subcommunities. The plot shows βik values, scaled by −1/αii of SC 1 to 14. Each bar shows the mean value and each yellow extension represents the s.d. of the top 200 parametric instantiations of the SC model. The three environmental conditions are ordered as water temperature, ammonia, and nitrate–nitrite. Most environmental effects are positive.
