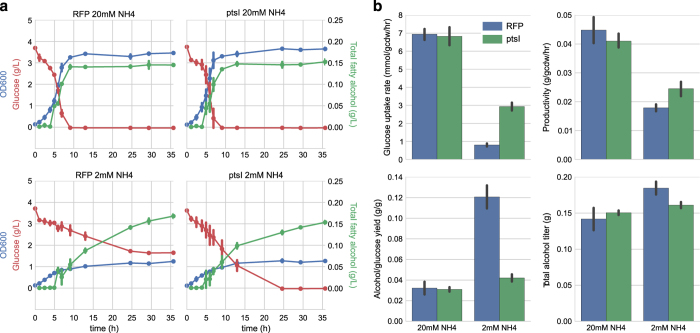
Figure 3.
Fatty alcohol production in nitrogen-starved E. coli. (a) Time course of optical density, glucose and total fatty alcohols in wild type (left) or PtsI-overexpressing (right) cells and either carbon-limited (top) or nitrogen-limited (bottom) media. Error bars are 95% confidence intervals based on two biological replicates. (b) Production metrics (glucose uptake rate and fatty alcohol yield, titer and productivity) for the strains and conditions above. Error bars are 95% confidence intervals based on four biological replicates (two cultures on two different days).

