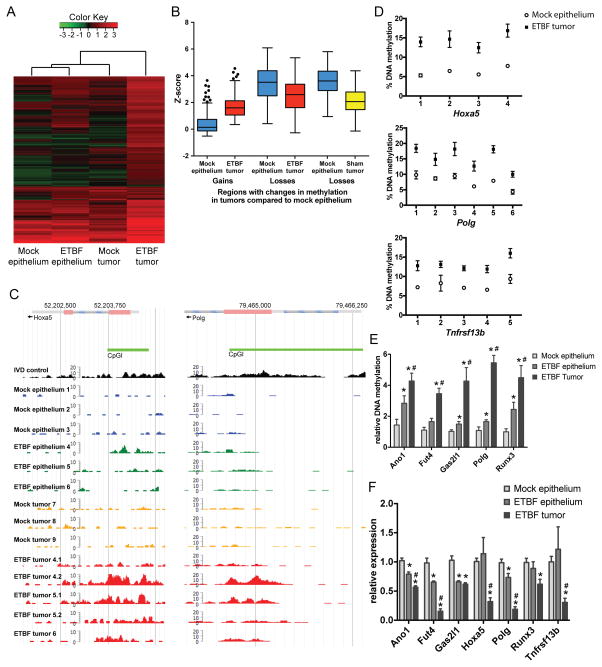
Figure 1. Inflammation-induced tumors have unique DNA hypermethylation alterations.
A) Unsupervised hierarchical clustering of MBD-seq z-scores of the 239 regions with DNA hypermethylation in one of the tumor groups relative to mock epithelium (rows). Each column corresponds to the indicated epithelium or tumor sample. The color of each cell reflects the degree of methylation. All tissue samples were collected 8 weeks after inoculation (N=3 mock and ETBF epithelium and mock tumors; N=5 ETBF tumors). B) Tukey box plots of z-scores of regions with gains or losses of methylation in ETBF or mock tumors relative to mock epithelium. C) MBD-seq data at representative regions for indicated epithelium and tumors. In vitro methylated DNA (IVD) serves as a positive control. D) Pyrosequencing of bisulfite treated DNA from indicated tissue in promoters of candidate genes. Mean +/− SEM. N≥6. *p<0.05. E) qMSP of samples as in D. *p<0.05 compared to mock epithelium. #p<0.05 compared to ETBF epithelium. F) Gene expression by qPCR of candidate genes relative to mock epithelium. Mean +/− SEM. N≥6. *, # as in E. See also Figure S1.

