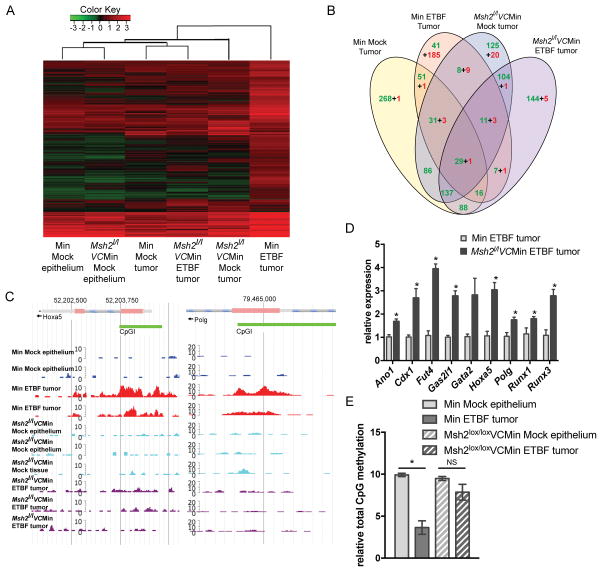
Figure 5. Msh2 deficiency abrogates inflammation-induced epigenetic changes in tumors.
A) Unsupervised hierarchical clustering of MBD-seq z-scores of regions with increased DMRs in one of the tumor groups relative to mock epithelium (rows). Each column corresponds to the indicated epithelium or tumor sample. The color of each cell reflects the degree of methylation. B) Numbers of DMRs for the indicated tumor group relative to the corresponding mock epithelium that overlap between comparisons. Green and red numbers are hypomethylated and hypermethylated regions, respectively. C) MBD-seq data at representative regions for indicated epithelium and tumors 8 weeks post-inoculation. D) Expression of candidate genes by qRTPCR relative to WT/Min ETBF tumors. Mean +/− SEM. N=5. *p<0.05. E) Total 5-mC content of DNA. Mean +/− SEM. N=3 mock, N=6 tumor. *p<0.05. See also Figure S5.

