
Figure 3.
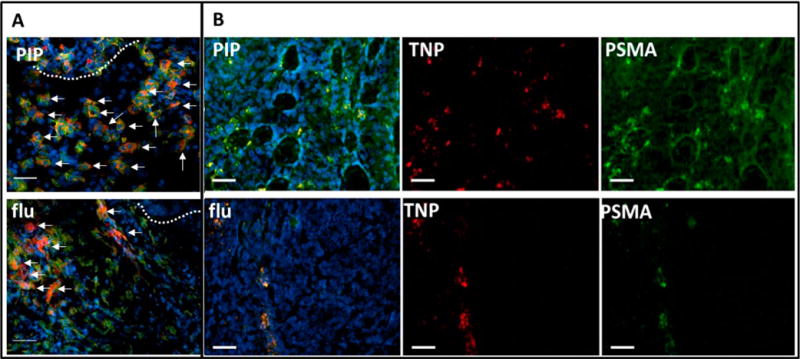
Epifluorescence micrographs of PSMA(+) PC-3 PIP (top panel) and PSMA(−) PC-3 flu (bottom panel) frozen sections containing ex vivo TNPs after 72 h of uptake. (A) Tumor rim (dotted line) of indicated xenografts showing TNP (red) accumulation (arrows) within abundant CD68+ macrophages (green). (B) Tumor parenchyma of indicated sections showing TNP (red) colocalization with anti-PSMA antibody staining (green) in PSMA(+) PC-3 PIP (top row) and within a linear pattern in PSMA(−) PC-3 flu (bottom row). Tumor sections were probed with anti-PSMA antibody (green) to define PSMA(+) tissues and Hoechst 33342 (blue) to reveal nuclei. These micrographs demonstrate delivery of TNPs to PSMA(+) tumor parenchyma (B, top row), and to PSMA(+) cells in a linear orientation, possibly within a vessel (B, bottom row). Colocalized TNP with PSMA is yellow (B, PIP and flu). Tumor sections are 20 μm thick, scale bar = 50 μm.