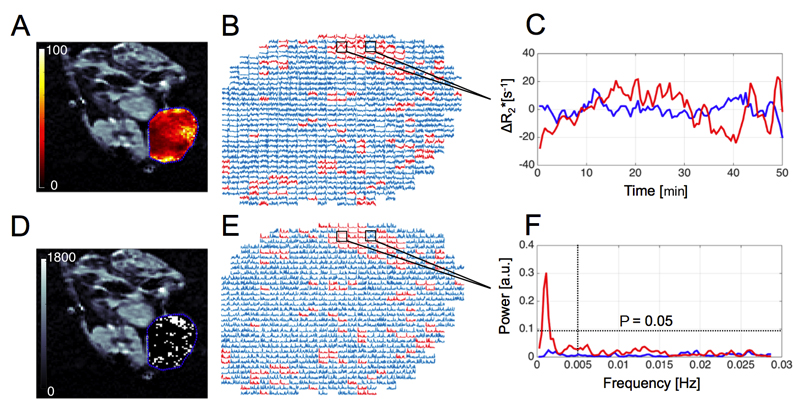
Figure 1.
A: Representative parametric R2* map (range: 0 – 100 s-1, axial orientation) calculated for a CALR HNSCC xenograft, with the tumor ROI delineated in blue. R2* time series (B, C) were used to calculate corresponding power spectra (E, F) and tested for the presence of non-random fluctuations. Significant non-Gaussian R2* fluctuations (white voxels in binary maps D), in the frequency range of 0-0.005 Hz were spatially mapped (chi-square test: at least one coefficient above P = 0.05, B – D).

