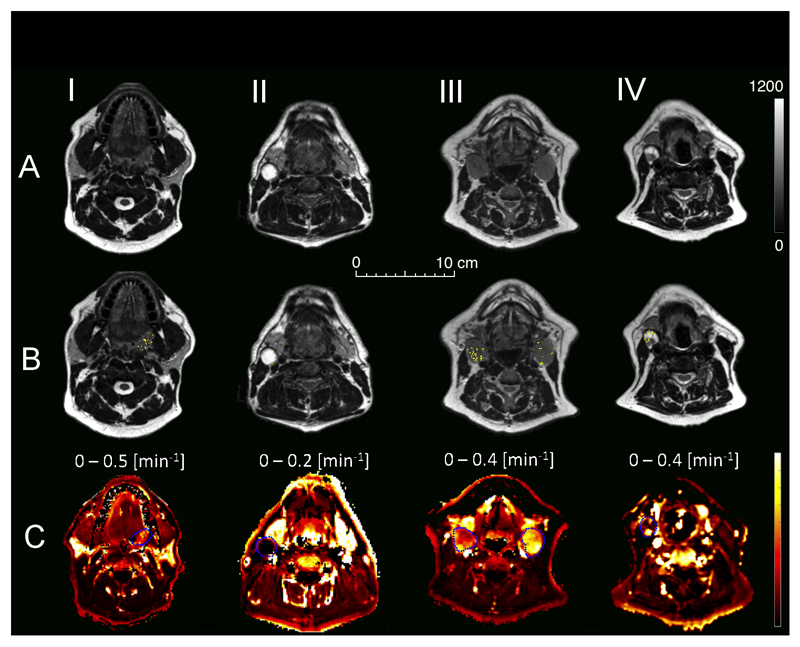
Figure 3.
Examples of T2-weighted axial MRI images of HNSCC patients (A). Distribution of spontaneous R2* fluctuations (B) within tumor ROI’s (white voxels) is presented for a primary tumor site (I, Pt No: 1), necrotic node (II, Pt No: 2) uniformly and non-uniformly contrast enhancing nodes (III, Pt No: 8 and IV, Pt No: 7). C: Corresponding DCE maps showing distribution of volume transfer constant between blood plasma and extracellular extravascular space (Ktrans).

