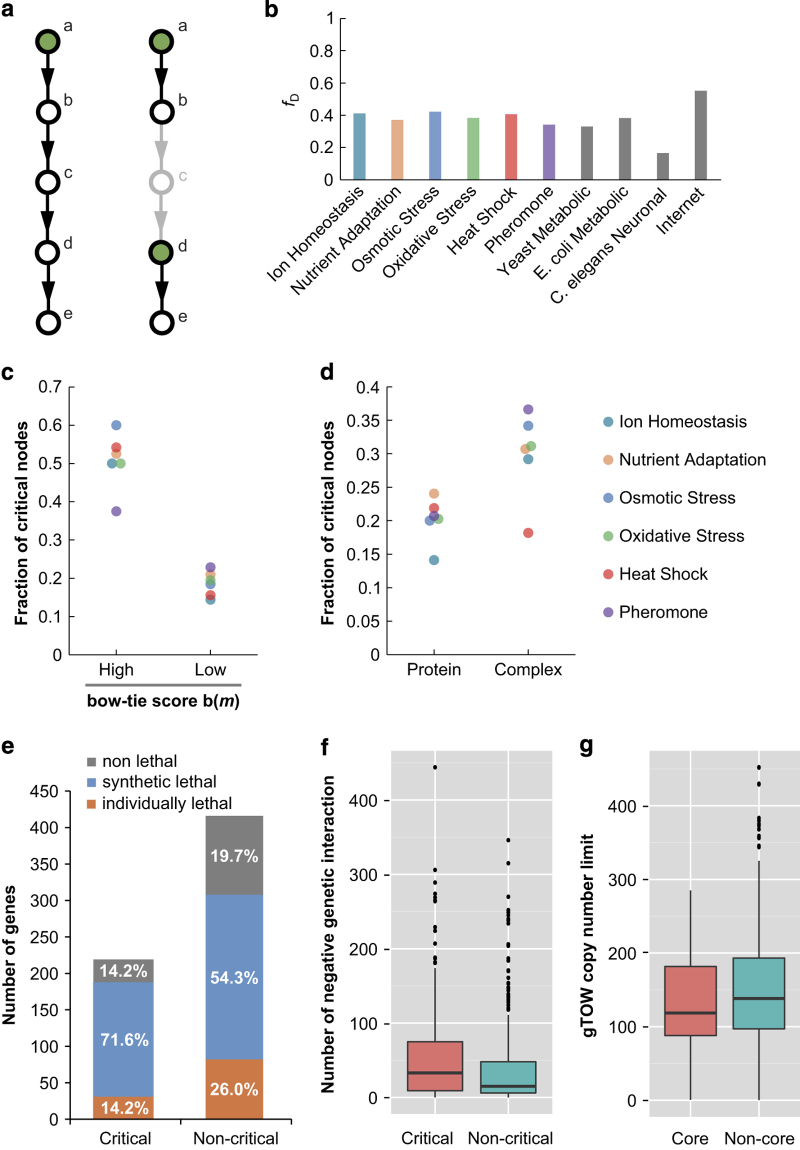
Figure 3.
Controllability of the yeast stress response pathways. (a) Left is a simple example of a directed network model, in which driver node a, indicated in green, can control all other nodes. When node c is removed as depicted on the right, the regulatory path connecting a and its target nodes is disconnected. Consequently, nodes d and e need to be individually controlled and the number of driver nodes increase. Thus, node c is important in connecting a regulator and its target, and is defined as a critical node. (b) The fractions of driver nodes, fD, for the six yeast stress response maps and other reference networks. The data for the other reference networks were obtained from a controllability paper by Liu et al.34 (c) The fraction of critical nodes among those with high and low bow–tie scores, b(m), calculated for six yeast stress response maps. (d) The fraction of critical nodes among monomeric proteins and complexes calculated in six yeast stress response maps. (e) Number of proteins whose corresponding genes are individually lethal, with at least one synthetic lethal interaction, and non-lethal phenotypes, with respect to critical and non-critical nodes. The phenotype relating to each gene was obtained from the SGD database. (f) The distribution of negative genetic interactions of critical and non-critical nodes represented in a box-and-whisker plot. The bottom and top of the box represent the first and third quartiles (hinges), respectively. The line through the box shows the median. The whiskers extend from the hinges to the highest or lowest value within the 1.5 interquartile range. Data not included between the whiskers are plotted as dots. Negative genetic interactions were obtained from the SGD database. (g) The distribution of copy-number limit of overexpression measured using the genetic tug-of-war (gTOW) method44 with respect to bow–tie core-associated genes and non-bow–tie core genes represented in a box-and-whisker plot (as described for f).

