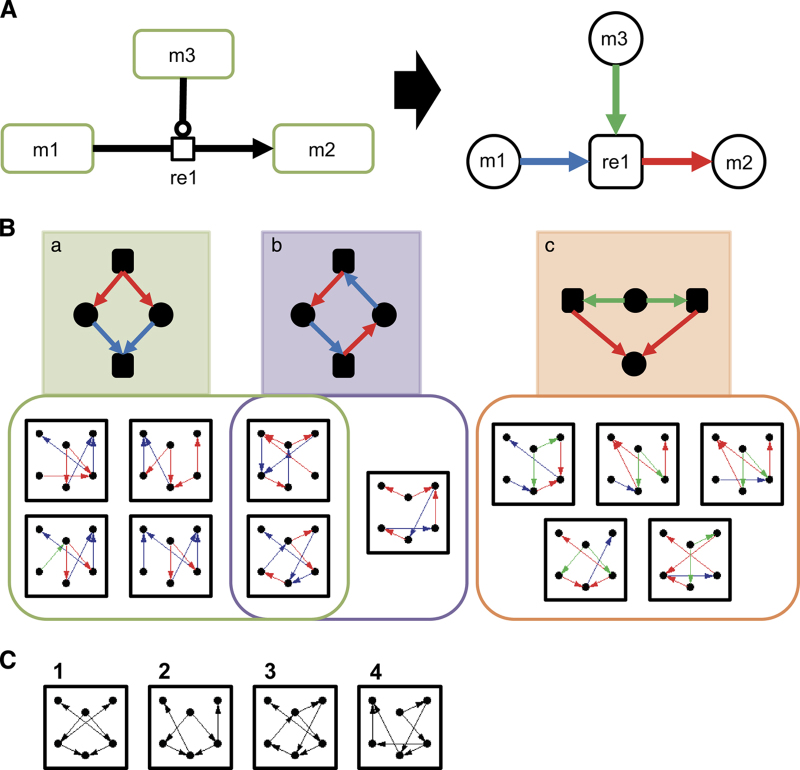
Figure 4.
(a) Conversion of the maps to bipartite-directed graphs for network motif analyses. The map on the left is a representation of a typical reaction, in which a molecule (m1) transitions to another state (m2) through a reaction (re1) catalyzed by m3. We treated both molecules and reactions as nodes connected by directed edges. The types of molecules (e.g., proteins, complexes etc.) and reactions (e.g., modification, transport, and so on) were ignored. All edges from reaction nodes to molecule nodes are in red, indicating ‘product’ edge. Blue arrows indicate ‘reactant’ edge, from a reactant molecule node to a reaction node, whereas green arrows represent the ‘modifier’ edge, from an enzymatic molecule node, which acts as a modifier of the reaction, to reaction node. The types of modifier, such as positive catalysis and inhibition, were ignored. (b) Network motifs specific to stimuli response pathways. Among 30 motifs common to the six yeast stress response pathways, 12 also appeared in other stimuli response pathways (EGFR, TLR, and mTOR signaling pathway) but not in non-stimuli response pathways (yeast cell cycle and influenza replication). These 12 motifs can be categorized into three groups, based on substructures. Motif groups responsible for substructure (a, b, c) are represented in green, purple, and orange, respectively. (c) Network motifs specific to stimuli response pathways identified without regard to edge labels. Among 47 motifs common to six yeast stress response pathways, only four also appeared in other stimuli response pathways. All of these motifs contained some of the substructures described in b. For instance, monocolor motif 1 corresponds to substructures (a, c), whereas these are indistinguishable in the monocolor motif.

