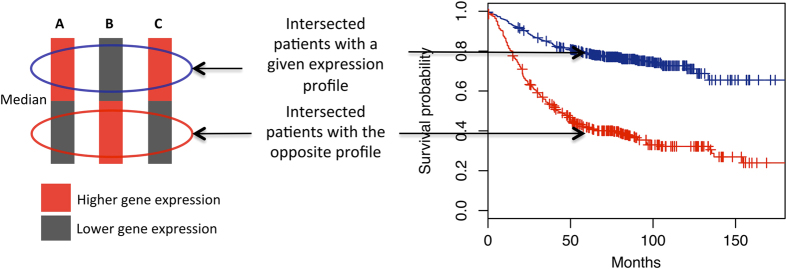
Figure 9.
Intersection of patients to perform a combined survival analysis. In this example, the combination evaluated is A::high-B::low-C::high (pro-survival group) against A::low-B::high-C::low (anti-survival group). Red and black blocks refer to the subsets of patients with expression values higher and lower than the median respectively. The separation between the pro- and anti-survival curves (in blue and red respectively) is optimized by SURCOMED to search for optimal combinations of marker genes.

