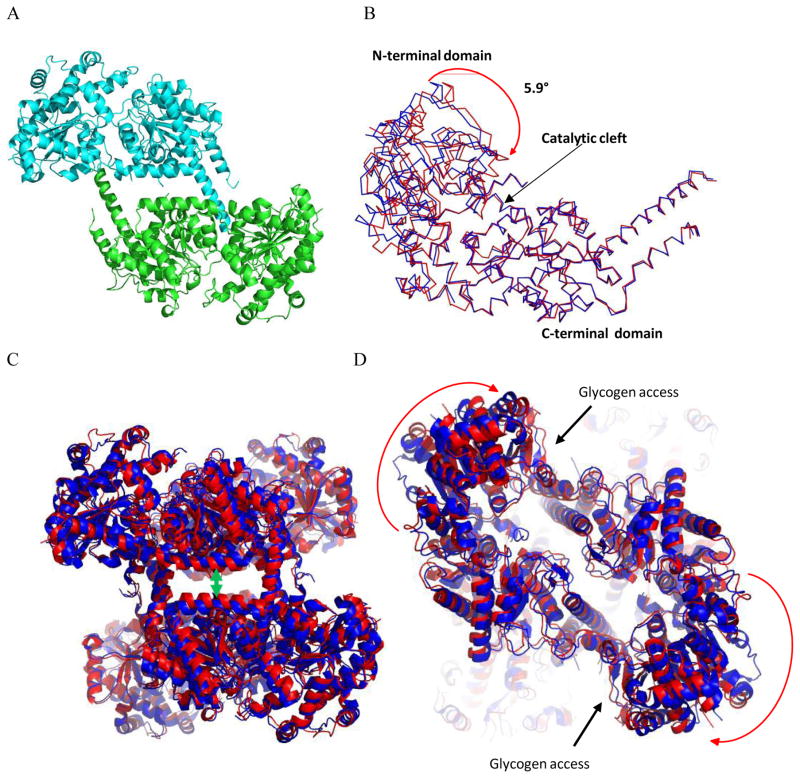
Figure 2. Comparison of inhibited and basal state structures of Gsy2.
A. Ribbon representation of yGsy2-R589A/R592A model as found in the asymmetric unit. Each monomer is colored separately. B. Ribbon representation of the superposed yGsy2-R580A/R581A/R583A basal (blue) and yGsy2-R589A/R592A inhibited (red) state monomers. The C-terminal domain (290–600) of each monomer was used for superposition using the center of mass option within the program Superpose in CCP4 suite. C. Ribbon diagram of the superposed basal (blue) and inhibited (red) state tetramers using the same superposition procedure as in panel B. The inhibited state structure has a more closed tetrameric interface. D. The same figure rotated 90° showing the acceptor access to the catalytic cleft is hindered in the inhibited state.

