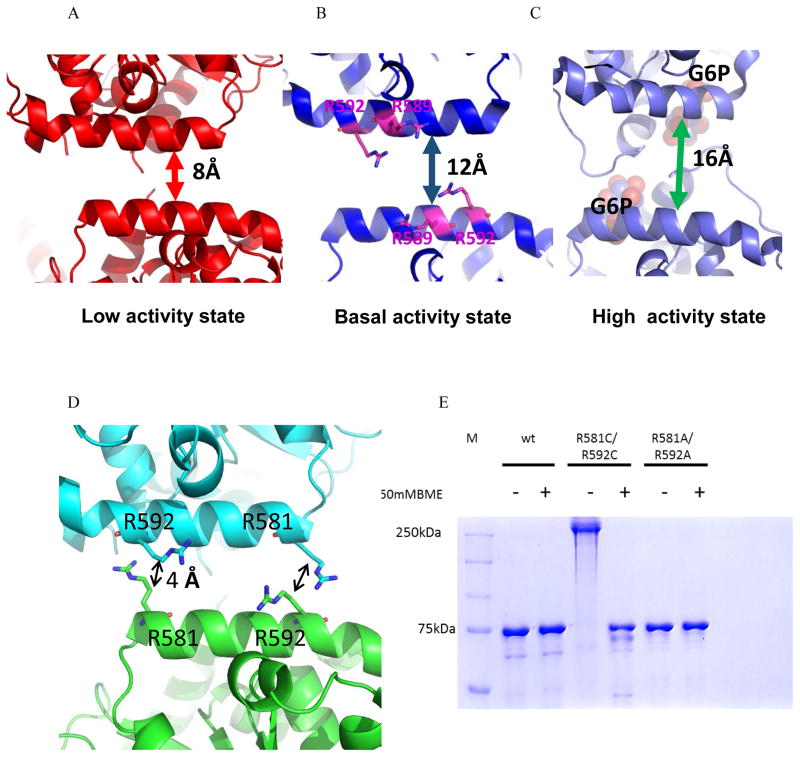
Figure 4. Redox regulation of yGsy2.
A, B and C. Ribbon representation of the regulatory helices of adjacent monomers in the yGsy2-R589A/R592A inhibited state, yGsy2-R580A/R581A/R583A basal state and G-6-P bound wild-type activated state respectively. The Arg589 and Arg592 in the basal state are shown in stick model and the bound sulfate ions are shown in space filling atom model. G-6-P (purple) bound in the activated state is shown in space filling atoms. D. Ribbon representation of the regulatory interface in the inhibited state. Each monomer is color schemed separately. The arginines 581 and 592 of adjacent monomers are showed in ball and stick model. E. Non-reducing SDS PAGE gel showing the mobility shift between the reduced and non-reduced forms of yGsy2-R581C/R592C mutant enzyme.

