
Figure 5.
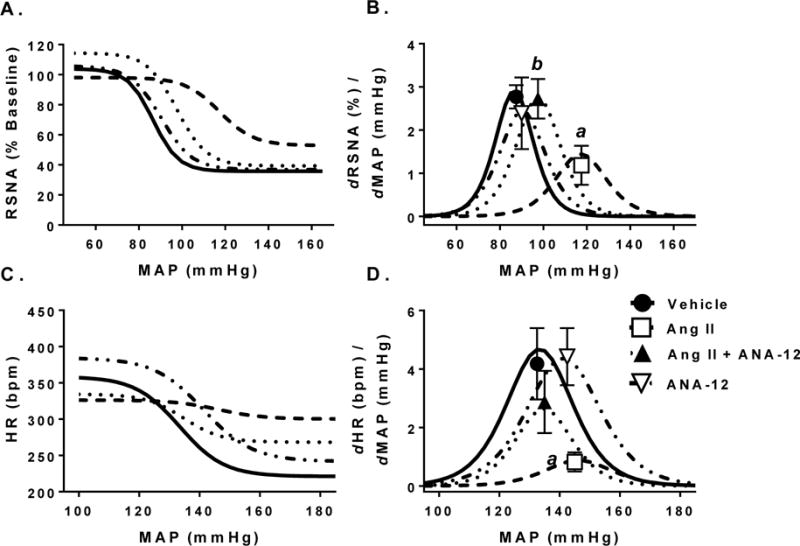
Baroreflex curves of renal sympathetic nerve activity (RSNA) and heart rate (HR) changes to increased mean arterial pressure (MAP) in response to administration of sodium nitroprusside and phenylephrine. A) RSNA response to increases in MAP quantified as a % of baseline where 100% represents the activity before infusion of sodium nitroprusside. B) Gain of RSNA baroreflex across MAP. Symbols represent max gain of baroreflex. C) HR response to increases in MAP. D) Gain of HR baroreflex across MAP. Symbols represent max gain of baroreflex. a, p < 0.05 vs. Vehicle; b, p < 0.05 vs. Ang II.