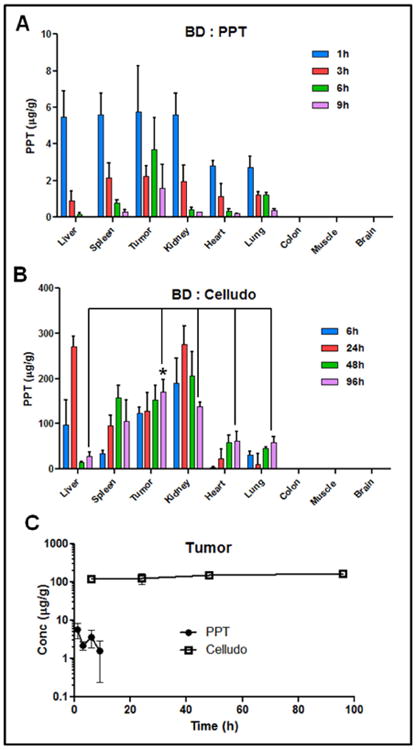
Figure 3.

Biodistribution of PPT delivered as free PPT or Celludo. Free PPT or Celludo was i.v. administered into EMT-6 AR1 tumor bearing BALB/c mice, and the released and total PPT in the tissues were extracted and measured by UHPLC/MS/MS. Data = mean ± SE (n = 3). A. BD of free PPT (inset: values at lower scale). B. BD of Celludo. C. Comparison of tumor uptake between free PPT and Celludo. * indicates significant difference (p < 0.05).
