
Figure 5. Thalamic c-fos expression increased after administration of VGAT shRNA (Experiment #2).
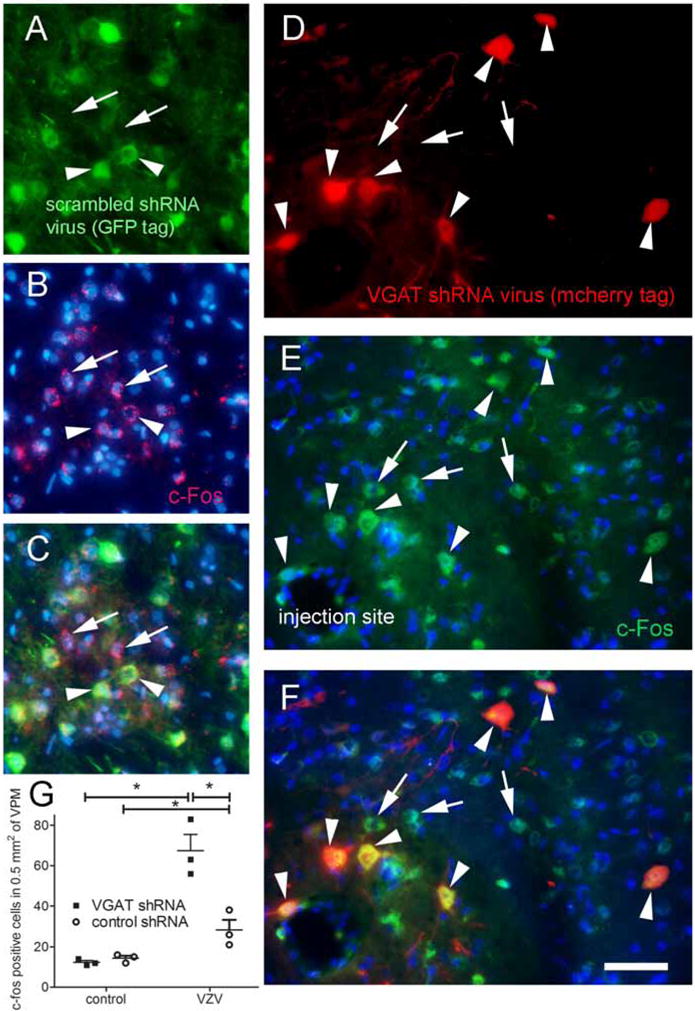
In these experiments AAV was injected, then VZV was injected one week after AAV and then one week after VZV injection the nociceptive measurements were started. Nociceptive measurements were carried out for two weeks after VZV injection. Animals were sacrificed immediately following the tests in week two for c-fos quantitation. Panel A shows cells in the ventral posteromedial thalamic nucleus three weeks after being transduced with the AAV5 virus containing the control shRNA construct expressing GFP (arrowheads, green). Panel D shows cells in the thalamus three weeks after being transduced with AAV9 containing the VGAT shRNA construct expressing mCherry (arrowheads, red). Panels B and E shows c-fos positive cells (arrows and arrowheads, red). In panels C and F c-fos positive cells co-localize with shRNA expressing cells (yellow, arrowheads). In this rat VZV was injected into the contralateral whisker pad. Blue is nuclear Hoechst stain. Bar equals 50 μm. Panel G is a histogram for cell counts of c-fos positive cells in the ventral posteromedial thalamic nucleus after three weeks after infusion of AAV containing shRNA constructs and after injection of VZV or control. An asterisk indicates a significant difference of p<0.05. There were three animals in each treatment group.