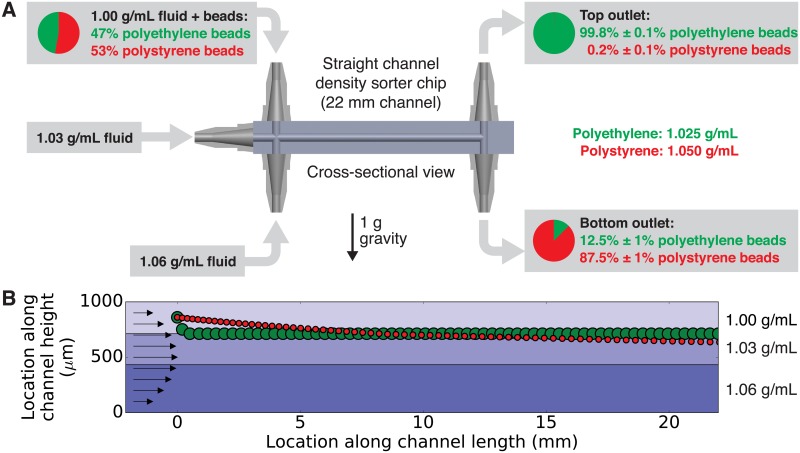
Fig 3.
(A) Using the density sorter chip to sort microbeads by their density. The inlets of the density sorter chip received fluid of three different densities (1.00 g/mL in the top inlet, 1.03 g/mL in the middle inlet, and 1.06 g/mL in the bottom inlet). The top inlet fluid also contained a 47:53 mixture by number of polyethylene beads (density 1.025 g/mL) and polystyrene beads (density 1.050 g/mL). The beads collected at the top outlet were an average of 99.8% polyethylene, and the beads collected at the bottom outlet were an average of 87.5% polystyrene. The uncertainties in percentage points represent the standard deviation of three replicates of this experiment. (B) Using our density_sorter.py software (S1 File) to simulate this experiment and calculate the locations of the polyethylene and polystyrene beads at 5 second intervals. For a larger but less-dense polyethylene bead (green circle) starting in the middle of the top density layer, the bead reaches the interface between the top two density layers in around ten seconds and remains there as it flows through the chip. However, for a smaller but more-dense polystyrene bead starting in the same location, the bead does not quite reach the midpoint of the channel within the 22 mm channel length. This may explain the lower purity of polystyrene beads in the bottom outlet of the chip.

