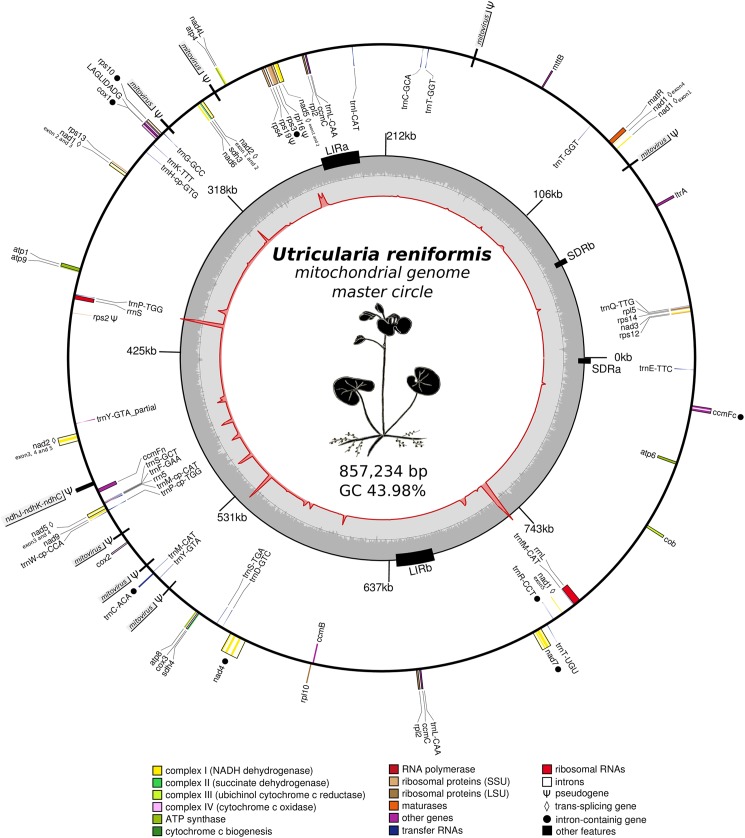
Fig 1. Genomic map of the Utricularia reniformis mtDNA genome.
The inner red circle illustrates the transcript depth of coverage for U. reniformis mtDNA, whereas the peaks represent the most covered regions by RNAseq reads. The second level circle in gray scale represents the GC% distribution across the mtDNA. The Large inverted repeats (LIR) and Small direct repeats (SDR) are shown as black boxes. The mitochondrial genes are shown in the outer circle, whereas genes shown on the outside of the map are transcribed clockwise, and the genes on the inside are transcribed counter-clockwise. Genes are color coded by their function in the legend, whereas partial mitovirus derived sequences are shown in gray boxes. The ndhJ-ndhK-ndhC loci which is deleted from the U. reniformis plastid genome is shown in the gray box.

