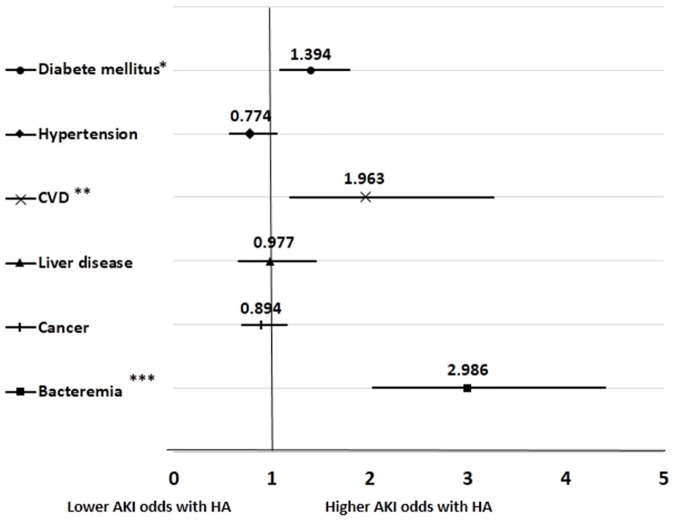
Fig 3. Forest plot of the odds ratio for AKI development in the multivariate logistic regression model.
The odds ratio is adjusted for all covariables in Table 1. *P-interaction < 0.05, **P-interaction < 0.01, and ***P-interaction < 0.001. AKI, acute kidney injury; CVD, cardiovascular disease; HA, hypoalbuminemia. Error bars indicate 95% confidence intervals.

