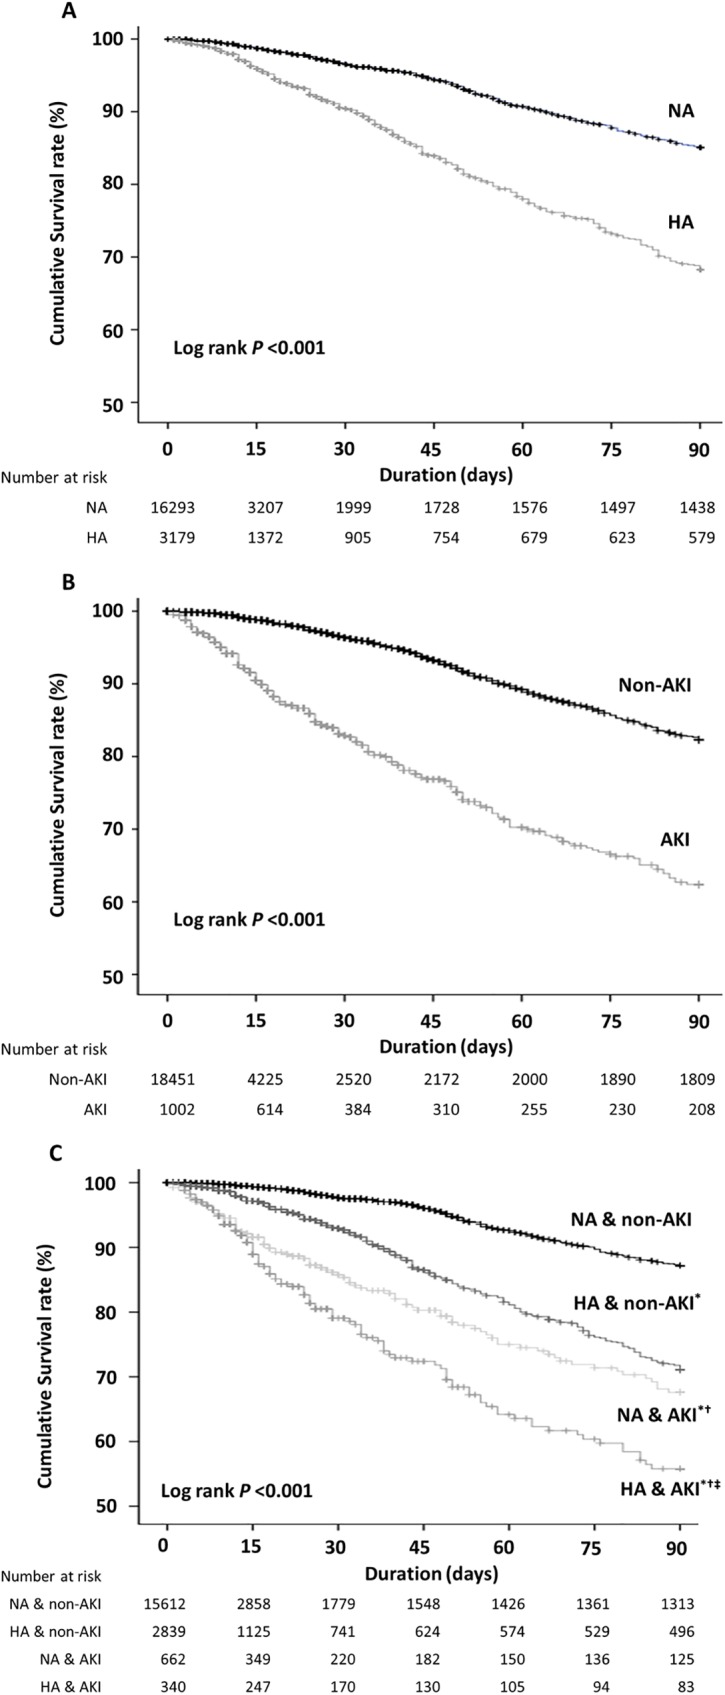
Fig 4. Cumulative survival rate according to the serum albumin and acute kidney injury groups.

A, B, and C show the survival curves of the serum albumin, AKI, and combined albumin and AKI groups for the mortalities, respectively. *P < 0.001 vs. patients with NA without AKI; †P < 0.001 vs. patients with HA without AKI; ‡P < 0.01 vs. patients with NA and AKI using the log-rank test. AKI; acute kidney injury, HA; hypoalbuminemia, NA; normoalbuminemia.
