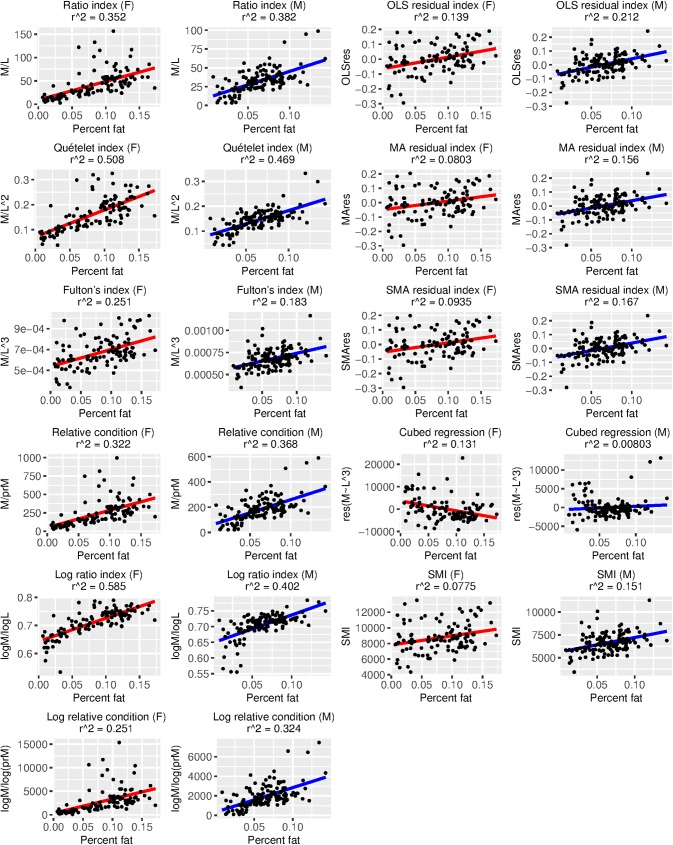
Fig 2. Relationships between 11 body condition indices (BCIs) and percent fat, a measure of true body condition, for each sex.
Variation in each BCI that can be explained by percent fat is provided as an r2 value. Ideally, most variation in a BCI should be attributable to variation in true body condition, and there should be a positive linear relationship between the BCI and true body condition. Descriptions of each BCI are provided in Table 1.

