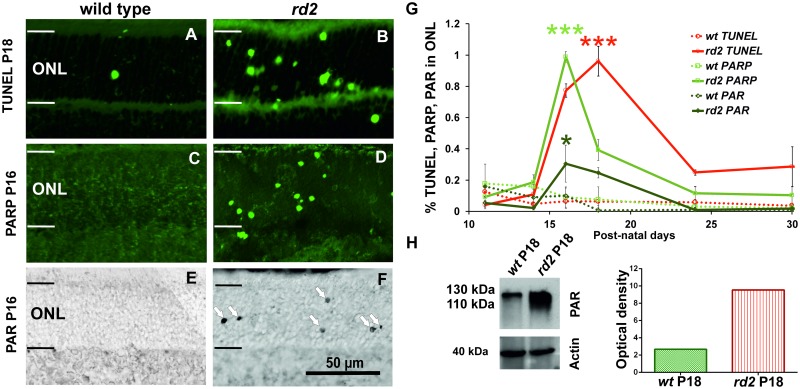
Fig 1. Progression of cell death and PARP activity in the early post-natal rd2 retina.
The TUNEL assay for dying cells showed significantly increased numbers of positive cells between P14 and P24, and peaked at P18 in rd2 retinae (A,B,G). The quantification of PARP activity positive cells over time identified significantly higher numbers of positive cells at P16 and P18 in rd2 ONL (C,D,G). Similar to PARP activity, immunohistochemical analysis of PARylated proteins revealed significantly increased numbers of PAR positive cells at P16 and P18 in rd2 retina (E,F,G). Remarkably, while PARP activity and PARylation of proteins peaked at P16, the peak of cell death occurred only at P18. Western blot analysis confirmed increased levels of PARylated proteins in rd2 retina at P18. The images shown in A-F are representative for observations on at least three different specimens for each genotype. Data shown in G is based on marker quantifcations in three different wt and rd2 animals per time-point; note that the wt datasets were in part published previously in [9,20].

