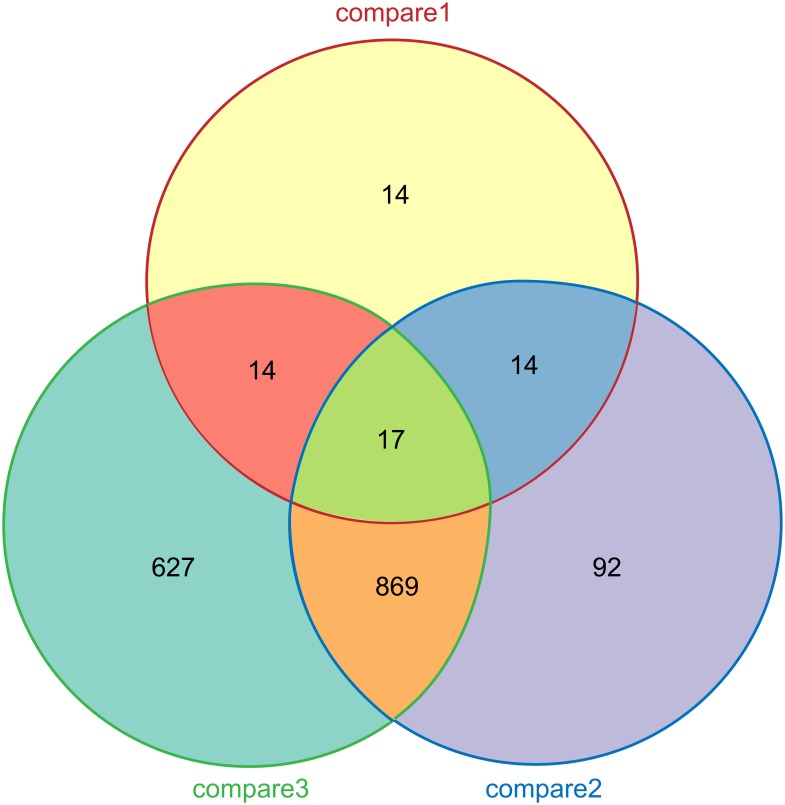
Fig 2. Venn diagram of differentially expressed genes.
WT, Unrolled, and Rolled are different experimental samples of rice plant. Compare 1 represents differentially expressed genes between Rolled and WT; compare 2, between Unrolled and WT; and compare 3, between Unrolled and Rolled. The figures denote the numbers of differentially expressed genes.

