FIGURE 5.
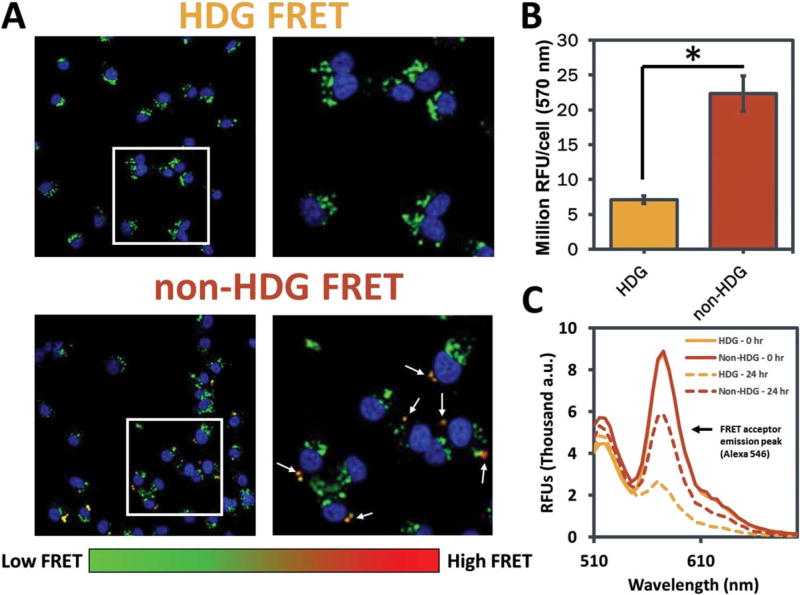
Analysis of intracellular un-packaging of oligonucleotides delivered from non-HDG- and HDG-NPs by FRET microscopy. A: Representative microscopy images of MDA-MB-231s after delivery of FRET-labeled dsDNA from non-HDG- and HDG-NPs. FRET signal is detected consistently within cells treated with non-HDG-NPs, whereas minimal FRET is detected within HDG-NP-treated cells. All images are presented at the same intensity scale. B: Microscopy image quantification of emission intensity at 570 nm (FRET acceptor emission; n=4, 9 images/n,>9000 cells total). C: Fluorescence spectra of FRET-labeled NPs at 0 and 24 h incubation in PBS.

