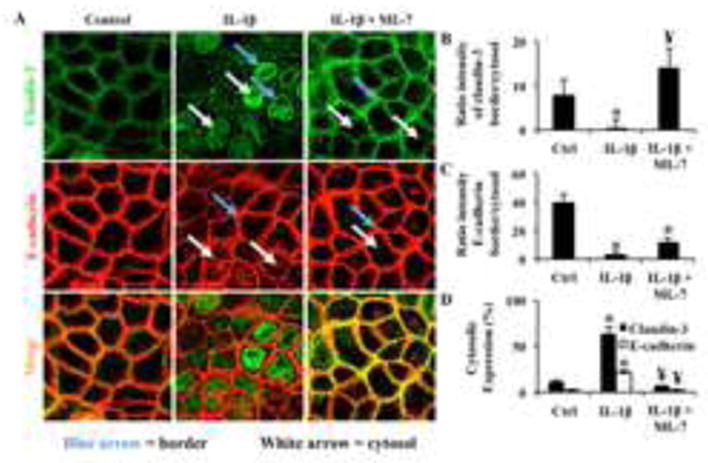
Fig. 3.

Inhibition of nmMLCK results in attenuated accumulation of cytosolic claudin-3. (A) Caco2 cells were treated with vehicle control or ML-7 (10 μM) followed by IL-1β treatment and claudin-3 protein localization was assessed by immunofluorescent confocal microscopy. Quantitation represents (B) the ratio of intensity of claudin-3 (green) detection at the cell-cell border (blue arrows) vs. cytosolic expression (white arrows), (C) the ratio of E-cadherin intensity at cell-cell borders (blue arrows) vs. cytosolic expression (white arrows), and (D) the percentage of cytosolic claudin-3 or E-cadherin from total intensity for each treatment. Results are representative of 3 experiments. * p<0.05 relative to vehicle control, ¥ p<0.05 relative to IL-1β alone.
