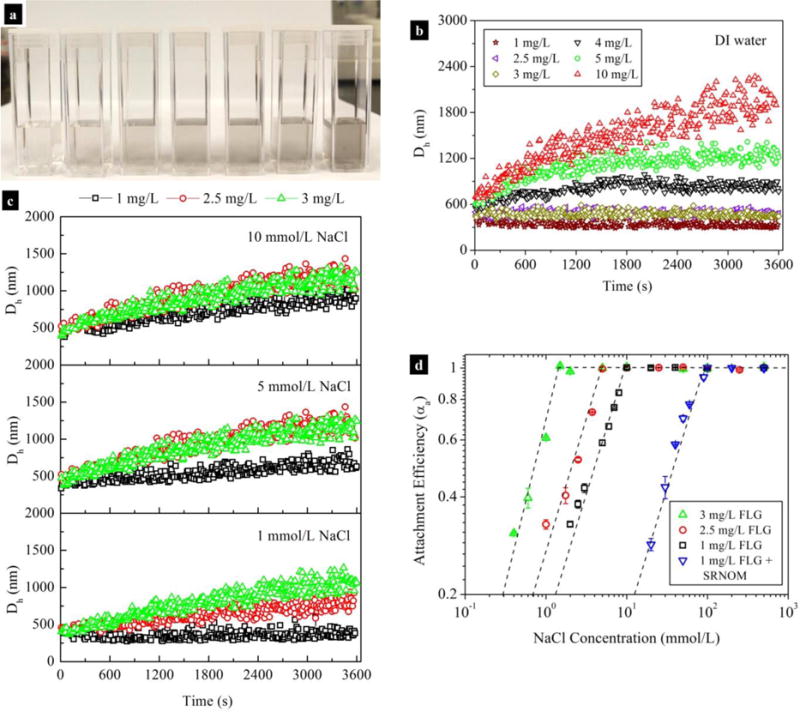
Fig. 1.

(a) Photograph of cuvettes containing various concentrations of FLG dispersed in DI water. Agglomeration profiles of FLG in DI water (b) or NaCl solutions (c) at various FLG concentrations at pH 7.0. Attachment efficiencies (d) of FLG determined at different FLG concentrations as a function of NaCl concentrarion (pH 7.0) in the absence and presence of 0.57 mg TOC/L SRNOM; data points are mean and standard deviation values that calculated from triplicate samples.
