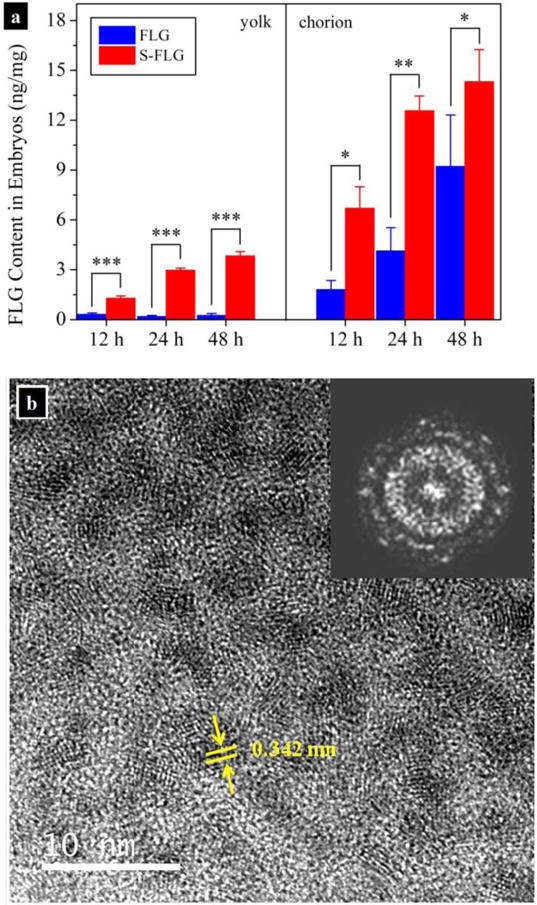
Fig. 5.

(a) Effects of lateral size on uptake of FLG by zebrafish embryos and distribution of FLG in chorion and yolk. Zebrafish embryos were exposed to (75 ± 1) μg/L of FLG and small FLG (S-FLG) (n=3; uncertainties indicate standard deviation values). Data points are mean and standard deviation values that calculated from triplicate samples. Asterisks indicate statistical difference (*, p<0.05; **, p<0.01; ***, p<0.001) between treatments. (b) HRTEM images taken from ultra-thin section of the yolk that exposed to the S-FLG for 48 h; Inset: fourier transfer image of (b) indicates the crystalline structure of graphene.
