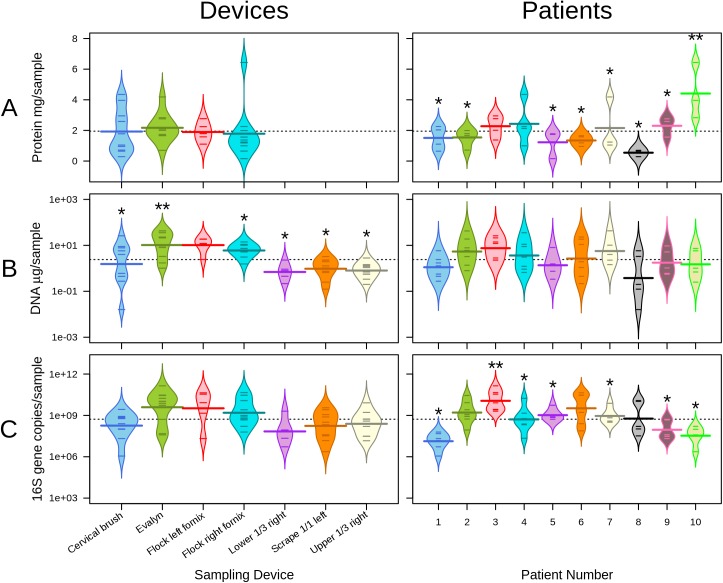
Fig 3. Protein and DNA results for different devices and patients.
Protein yield (row A), DNA yield (row B) and total bacteria measured by qPCR (row C). The individual lines depict mean and the overall dotted line the group mean. The left columns show values according to the sampling methods (technical variation) and the and right according to the patients (biological variation). Protein yield was not measured from scrape samples due to small sample volume. Mean values not sharing the same number of asterisks signify samples with statistically significant (p < 0.05) pair-wise differences.

