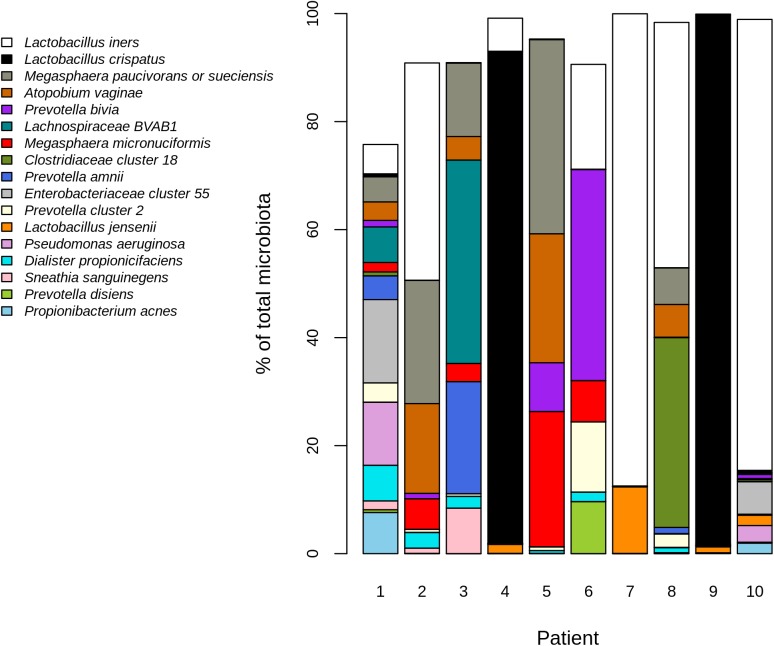
Fig 4. Abundant microbiota in the study subjects.
The plot shows the most abundant bacteria (mean relative abundance > 0.01) per patient, representing mean abundance derived from all the sampling methods. Patients 3,5,6,8 had bacterial vaginosis according to Pap smear at the time of sampling. Patient 1 gave birth 2 months before sampling and post-partum atrophy was seen in Pap smear. Area not covered by the bars represents taxa below the abundance filter.

