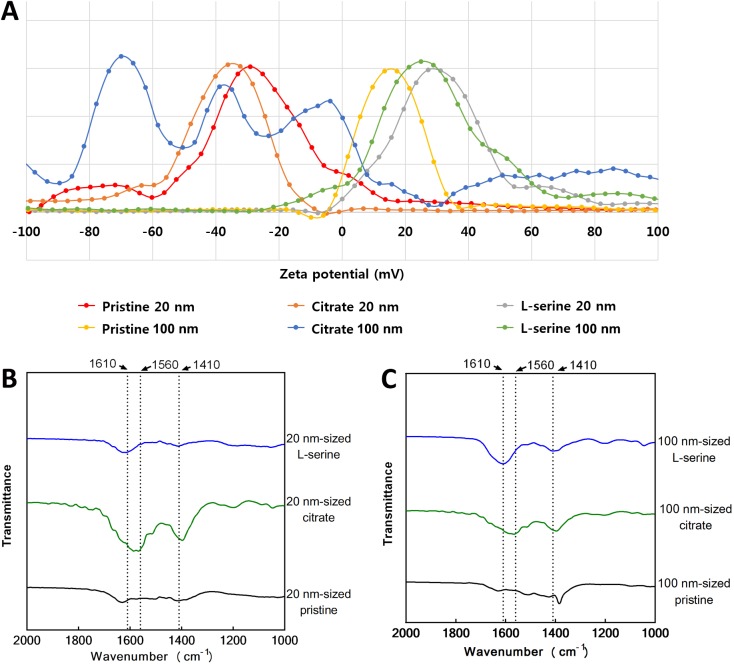
Fig 2. Surface charge and FT-IR analysis of ZnO NPs.
(A) Surface charge of ZnO NPs evaluated by the zeta potential measurement. FT-IR analysis of (B) 20 nm-sized ZnO NPs and (C) 100 nm-sized ZnO NPs. Note that citrate coated 20 nm- and 100 nm-ZnO NPs showed 1560 and 1410 cm-1 that are specific peak for asymmetric COO- and symmetric COO-, respectively. While L-serine coated 20 nm- and 100 nm-ZnO NPs showed 1610 and 1410 cm-1 which are specific for NH2 bending and symmetric COO-, respectively.

