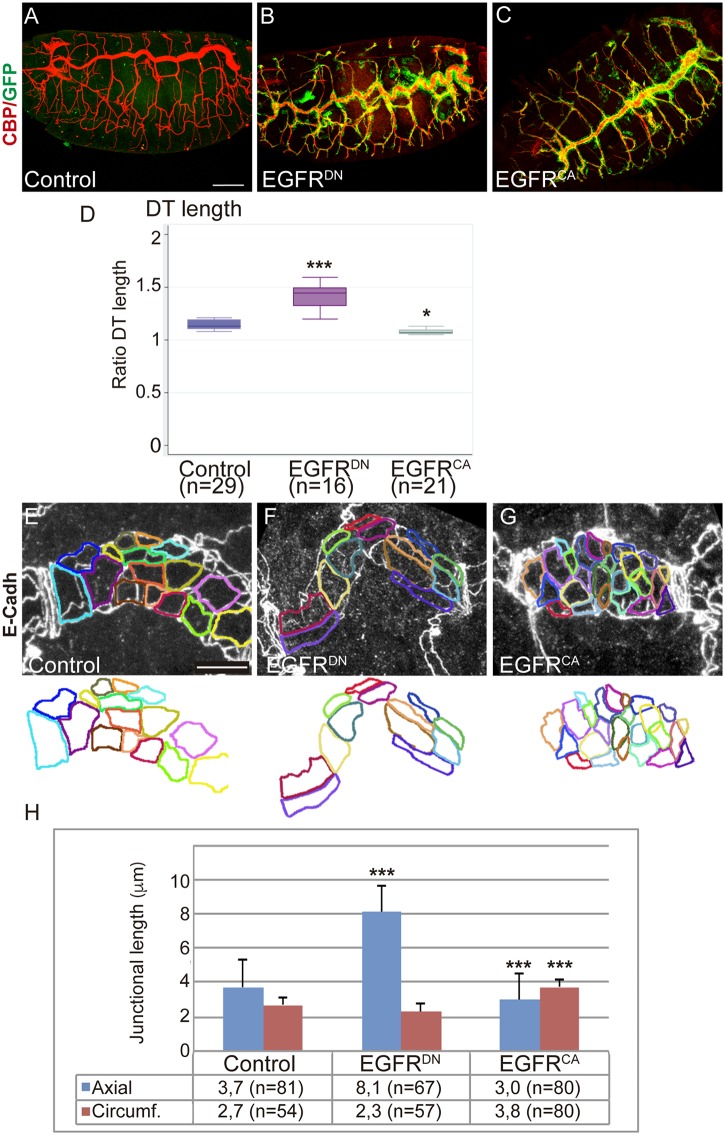
Fig 1. EGFR controls the elongation of the DT.
(A-C) Lateral views of stage 16 embryos stained for GFP (green) and CBP (red, lumen).Compare the elongated DT when EGFR is downregulated (btlGal4-UASsrcGFP-UASEGFRDN) to control (UAS-EGFRDN) and to EGFR overactivation (btlGal4-UASsrcGFP-UASEGFRCA). Scale bar 50 μm (D) Box plot for Ratio DT quantification (length of the tube/linear length) of the different experimental conditions of stage 16 embryos. n, number of embryos analysed. The single (*) and triple (***) asterisks represent P<0.05 and P<0.001, respectively, compared with the control by Student's t-test. (E-G) Details of 1 single tracheal metamere of stage 16 embryos stained for E-Cadh to visualise the apical cell shape. The apical outline is highlighted in colours. Note the axial elongation in EGFRDN mutant cells and the circumferential expansion in EGFRCA. Scale bar 7,5 μm (H) Quantification of the length of the axial and circumferential junctions. n, number of cells analysed from 3 different embryos per genotype. Triple asterisks (***) represent a significant difference from the control by Student's t-test (P<0.001).

