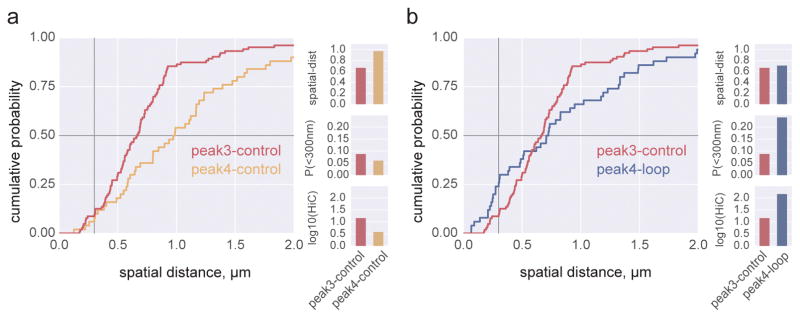
Figure 2. Experimental data demonstrate the complex relationship between Hi-C and FISH.
a. comparison between a pair of typical loci shows increased spatial distance and decreased Hi-C counts. b. comparison between a pair of loop loci and a control pair shows increased spatial distance, but increased Hi-C counts. FISH and Hi-C data re-plotted from (Rao et al, 2014) for GM12878 cells (Supplemental Table 1). Horizontal grey line intersects the median spatial distance, vertical grey line intersects the probability of an observation less than 300nm, P(<300nm). Bar plots show median spatial distance, P(<300nm), and log10(corrected Hi-C counts).

