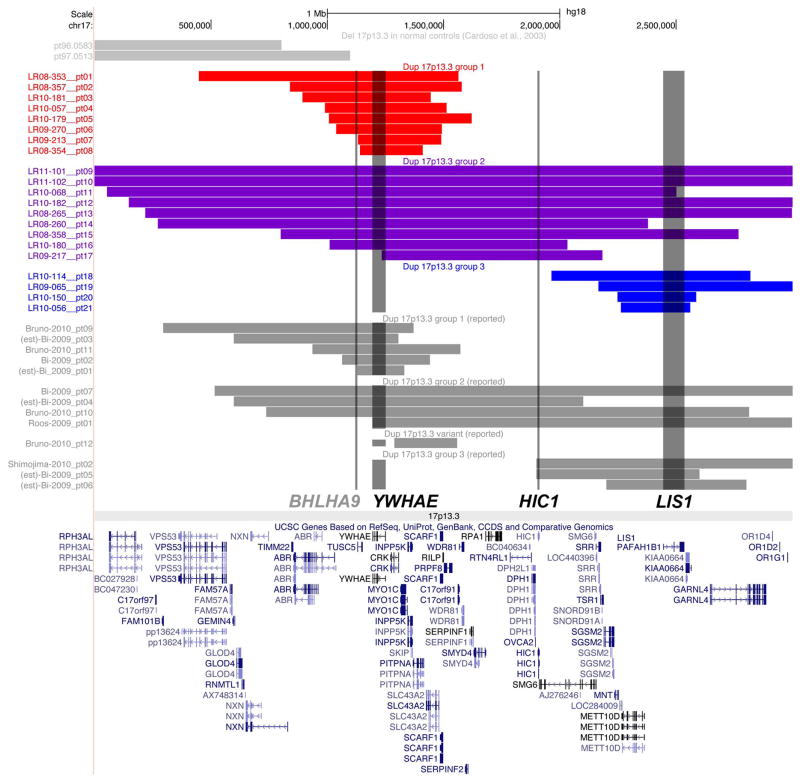
Figure 1.
A map of chromosome band 17p13.3 showing the genome location and gene content of duplications in all 21 families in our study as well as 13 additional patients from the literature was made using the Custom Tracks function in the UCSC browser (http://genome.ucsc.edu). The map shows Group 1 dups in red, Group 2 dups in purple and Group 3 dups in blue so that the differences in duplication size and position are obvious. The map also shows other reported dups in gray [Bi et al., 2009; Bruno et al., 2010; Roos et al., 2009; Shimojima et al., 2010].

