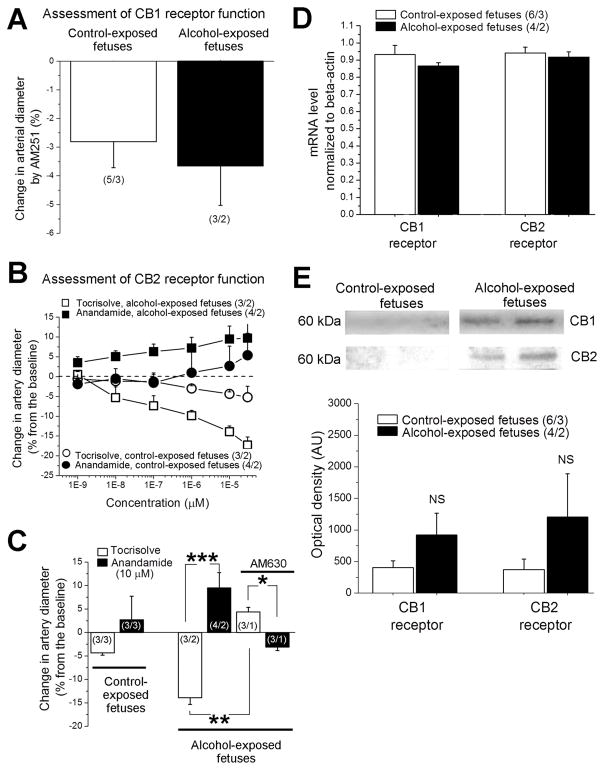
Fig. 4. Evaluation of CB1 and CB2 receptor function in pressurized fetal cerebral arteries in vitro.
A. Averaged data showing similar degree of artery constriction in response to CB1 receptor blocker AM251; data were compared using unpaired t test. B. Concentration-response curves for anandamide in vehicle Tocrisolve™ and corresponding curves for anandamide-free Tocrisolve™ obtained from cerebral arteries of control- vs. alcohol-exposed fetuses in presence of AM251 and pre-constricted with KCl. C. Averaged data reflecting anandamide-induced cerebral dilation in arteries from alcohol-exposed fetuses; this dilation disappears when AM251 is complemented with CB2 receptor blocker AM630. Artery data from control-exposed fetuses were compared using unpaired t test. For alcohol-exposed fetuses, three sets of data were compared using independent unpaired t tests: Tocrisolve- versus anandamide-induced changes in artery diameter in absence and in presence of AM630, and Tocrisolve-induced changes in artery diameter in absence versus presence of AM630. *Significantly different from Tocrisolve-induced changes in diameter, p < 0.05. **Significantly different from Tocrisolve effect, p < 0.01. ***Significantly different from Tocrisolve effect in absence of AM630, p < 0.001. (n/N) = number of artery segments/number of fetuses. D. Averaged values of mRNA concentration normalized to beta-actin show no significant differences in gene expression of CB1 and CB2 receptors between control- and alcohol-exposed fetuses. In D and E, data for CB1 and CB2 receptors were compared using independent unpaired t tests. E. Representative images of Western blot data (top panels) in cerebral arteries from control- and alcohol-exposed fetuses. Artery homogenate samples contained equal amount of total protein. Bar graph shows averaged values of optical density corresponding to CB1 and CB2 protein levels. NS: not significant.

