
Fig. 2. Association of structural variants with human-directed social behavior in multivariate regressions.
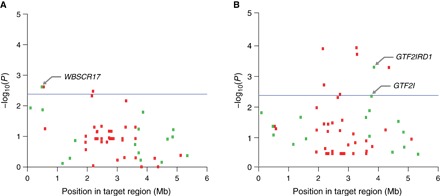
Association in behavioral index model (A) and PC model (B). Manhattan plots show statistical significance of each variant as a function of position in the target region. Blue line denotes significance to Bonferroni-corrected level (P = 2.38 × 10⁻³); dashed purple line denotes suggestive significance (P = 0.01). Genic and intergenic variants are shown as green and red boxes, respectively.